Insights
Analytics answers "how am I doing?". Insights answers a narrower and more urgent question: am I going to pass, and what do I need to change?
The four gauges
Insights opens with four scores, and each one is clickable for an explanation of what it measures and why it matters.

Each gauge explains its score in your own numbers
| Gauge | What it measures | Underlying number |
|---|---|---|
| Edge Score | How much you earn per trade on average | Expectancy, scaled against your average win and loss |
| Win Quality | The relationship between how often you win and how big those wins are | Profit factor |
| Consistency | How smooth and predictable your equity curve is | R-squared of the curve against a straight line |
| Risk Control | How well you manage drawdowns relative to profits | Recovery factor, total profit divided by max drawdown |
Edge Score needs 40+ trades before it will produce a number, and the other three need 20+. Below those thresholds the gauge shows amber with your current sample size instead of a score, and with no trades at all it shows grey. A 12-trade sample can show a 3x profit factor and mean nothing.
Each gauge also writes a sentence of context using your actual numbers rather than a generic band. Consistency matters most for an evaluation: it shows whether a result is repeatable rather than one lucky day, which is what most firms write a rule about.
How the gauges score
Each gauge converts one underlying number into a 0-100 score.
Edge Score, from expectancy
Expectancy is measured against your own typical trade size.
reference = max(|avg win|, |avg loss|, 1)
score     = 50 + (expectancy / reference) x 50      capped at 100
A score of 50 is breakeven. Expectancy equal to your reference trade size scores 100. Negative expectancy always scores red regardless of the number.
Win Quality, from profit factor
| Profit factor | Score |
|---|---|
| 3.0 and above | 100 |
| 2.0 to 3.0 | 75 + (PF - 2.0) x 25 |
| 1.5 to 2.0 | 60 + (PF - 1.5) x 30 |
| 1.0 to 1.5 | 40 + (PF - 1.0) x 40 |
| below 1.0 | PF x 40 |
Landmarks: PF 1.0 scores 40, 1.5 scores 60, 2.0 scores 75, 3.0 scores 100. Green starts at PF 1.67.
Consistency, from R-squared
score = R-squared x 100
A direct conversion, so an R-squared of 0.72 scores 72.
Risk Control, from recovery factor
| Recovery factor | Score |
|---|---|
| 5.0 and above | 100 |
| 3.0 to 5.0 | 80 + (RF - 3.0) x 10 |
| 1.0 to 3.0 | 50 + (RF - 1.0) x 15 |
| below 1.0 | RF x 50 |
Landmarks: RF 1.0 scores 50, meaning your profit exactly equals your worst drawdown. RF 3.0 scores 80, and RF 5.0 or better scores 100. Green starts at RF 2.0.
Color thresholds
All four gauges use the same thresholds: green at 65 and above, amber from 45 to 64, red below 45.
Prop Eval Tracker
Enter your firm's rules once and the tracker shows live progress against each of them.
| Rule | What it tracks |
|---|---|
| Profit Target | Net P&L against the target, as a progress bar |
| Max Drawdown | Your worst drawdown against the limit, with remaining buffer, and a drawdown type setting (Trailing, EOD, or Static) so each firm's rule is measured correctly |
| Daily Loss | Today's loss against the daily limit, with remaining buffer |
| Consistency Rule | The largest share of your total profit that came from any single day, against the firm's percentage cap |
The consistency check is the one people trip over. It scans every profitable day, works out each one's share of total profit, and reports the largest as PASS or FAIL against your configured percentage. A trader up $4,000 with $2,600 of it from one session fails a 50% rule while looking comfortably profitable everywhere else on the platform.
Set a starting balance and the tracker also reports account balance alongside the rules.
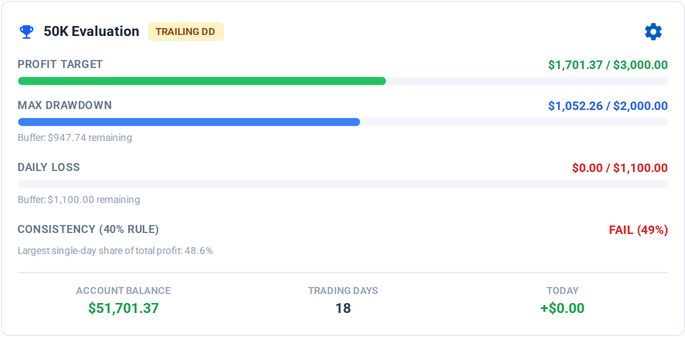
On pace for the profit target, and still failing the consistency rule
What-If Simulator
Four sliders, each starting at your actual current value:
- Win rate
- Average win
- Average loss
- Trades per day
Move any of them and the projection updates live, including the projection line on the chart.
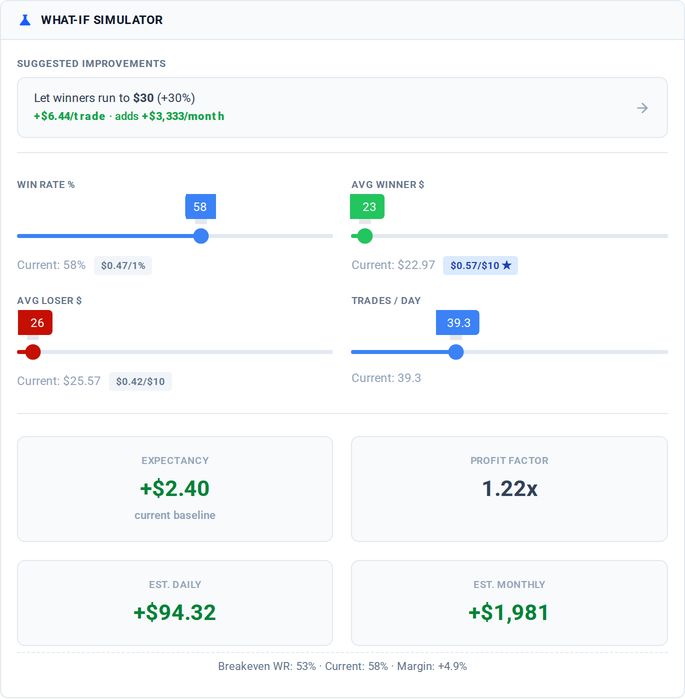
Four sliders, each starting at your actual number
Monte Carlo
Running the simulation plays out 500 randomized paths of up to 60 trading days each, sampling your actual trade P&L distribution scaled to the What-If settings, and reports:
- Pass probability
- Median outcome
- Average days to pass
- Worst case (10th percentile) and best case (90th percentile)
- Average max drawdown
- The profit target it measured against
A strategy with a healthy median can still show a 10th percentile that breaches your drawdown limit, and that is the run that ends an evaluation.
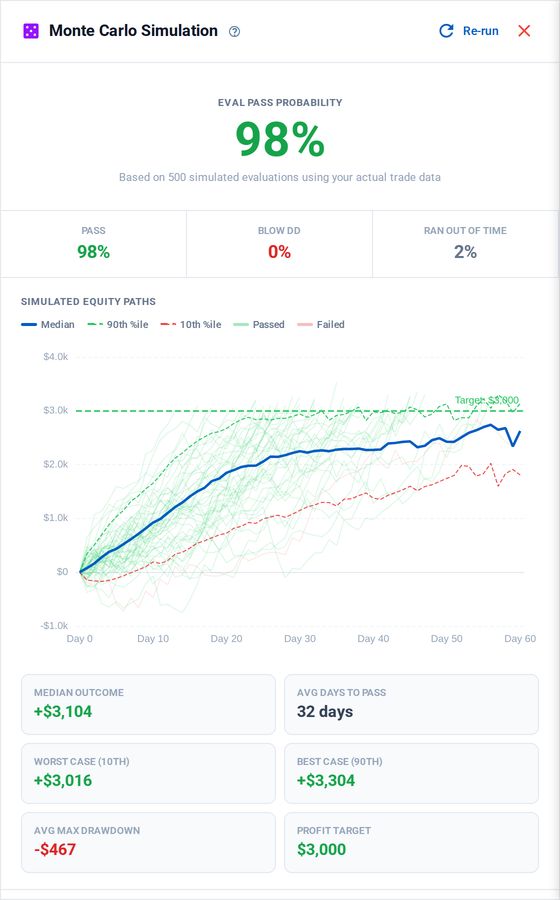
A Monte Carlo run against a 50K evaluation's rules
Simulations resample your own historical trades. They assume your future trades look like your past ones, which is exactly the assumption that breaks when you change markets, size, or approach. Past performance does not guarantee future results.
Adjust the What-If sliders and re-run to see how a change in behavior moves your pass probability.
Coaching Insights
Alongside the gauges, the page surfaces written observations from your own data, flagged by severity. Rule breaches such as a failed consistency check appear here as well as in the tracker, so the things most likely to end an evaluation are stated in plain language rather than left for you to infer from a chart.
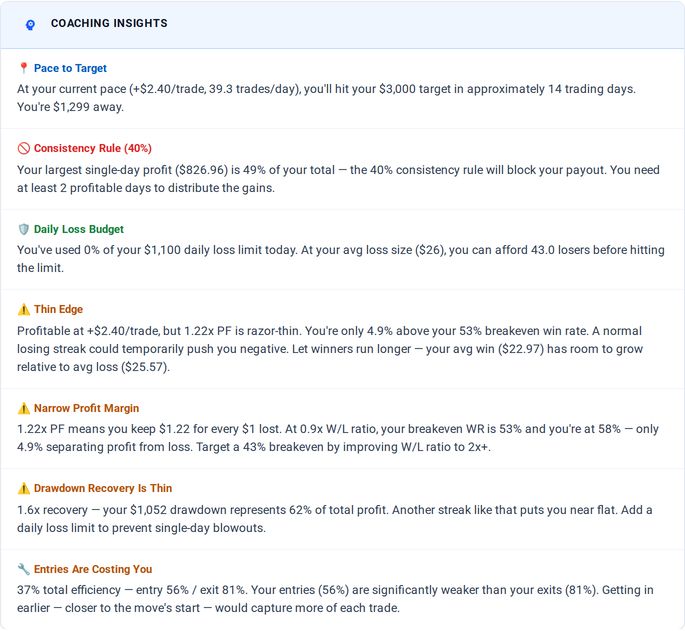
Observations from your own data, flagged by severity