Honoring the 2025 Pine Script® Wizards
CrossTrade is proud to highlight the newly announced 2025 Pine Script® Wizards — a group of talented TradingView developers recognized for their creativity, generosity, and impact on the Pine community.
At CrossTrade, we’re proud to celebrate and amplify the work of outstanding contributors across the TradingView ecosystem — even when it’s not directly tied to us. Today, we’re shining a light on the 2025 Pine Script® Wizards, recently announced by the team at TradingView.
These authors have contributed powerful, open-source scripts that have influenced thousands of traders and developers. They now enter the Hall of Fame among other TradingView greats. Whether you're a seasoned coder or just dipping your toes into Pine, their tools and creativity can inspire, educate, and elevate your trading experience.
Let’s meet the 2025 inductees:
LucF
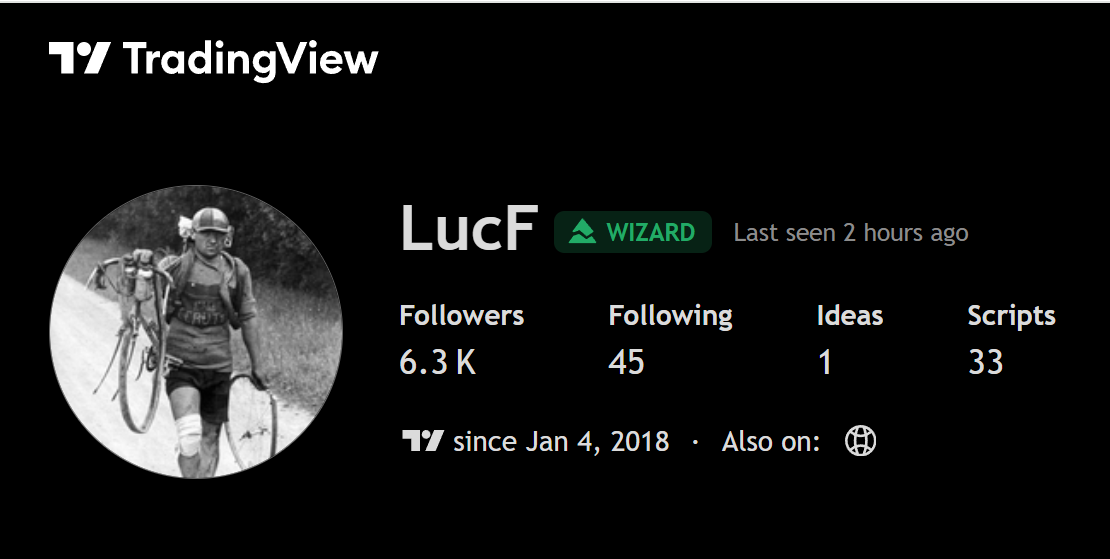
LucF is the guiding voice the Pine Script® community didn’t know it needed. His contributions have quietly shaped both the language and its culture, setting a high bar for quality, clarity, and presentation. With meticulously crafted scripts and elegant visualizations, LucF has set a gold standard for Pine developers — and his influence can be seen across countless other projects on TradingView.
With 33 published scripts, there is no shortage of options and use cases for users.
Some of this most popular scripts include:
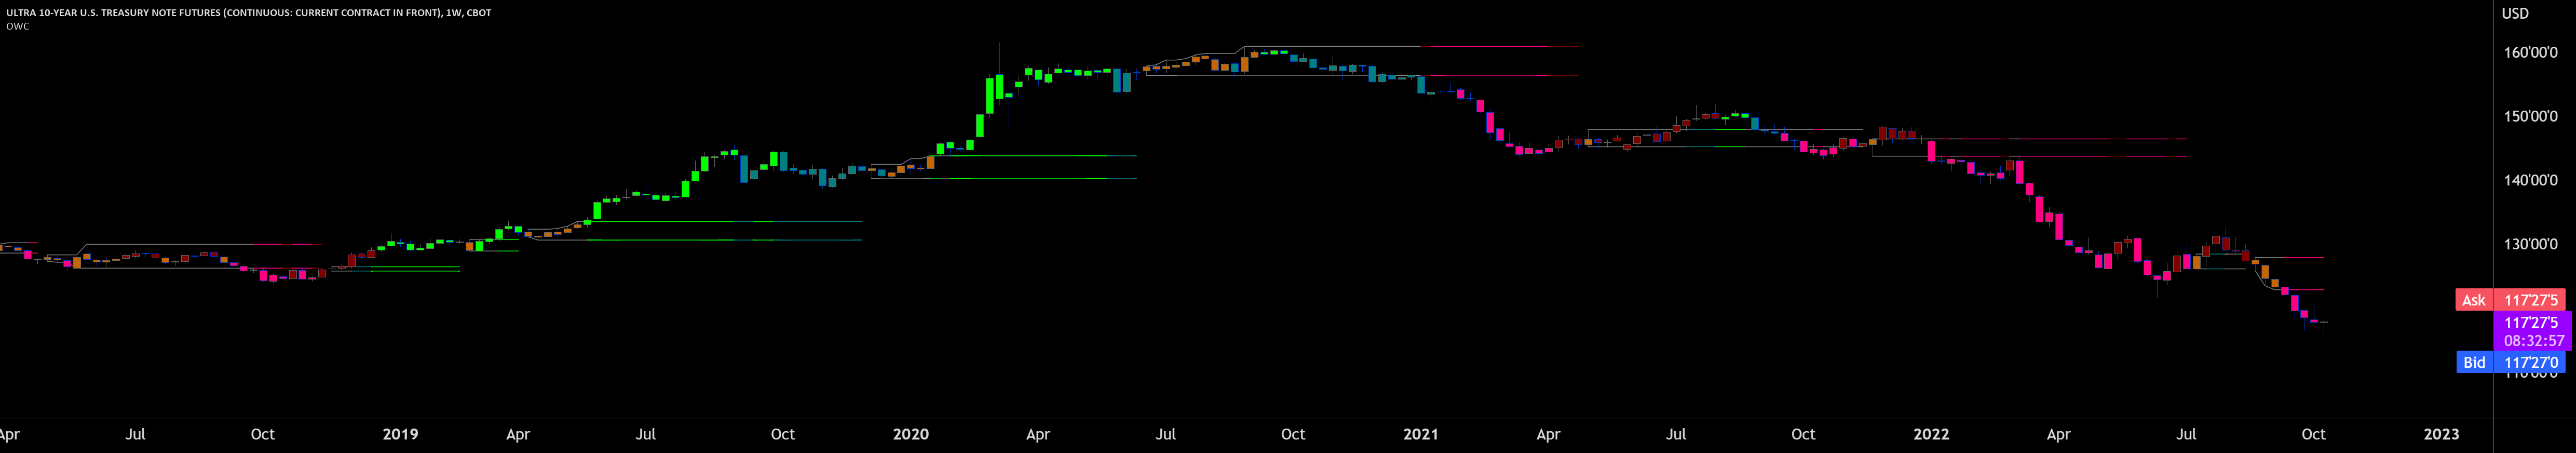
Oscillator Workbench
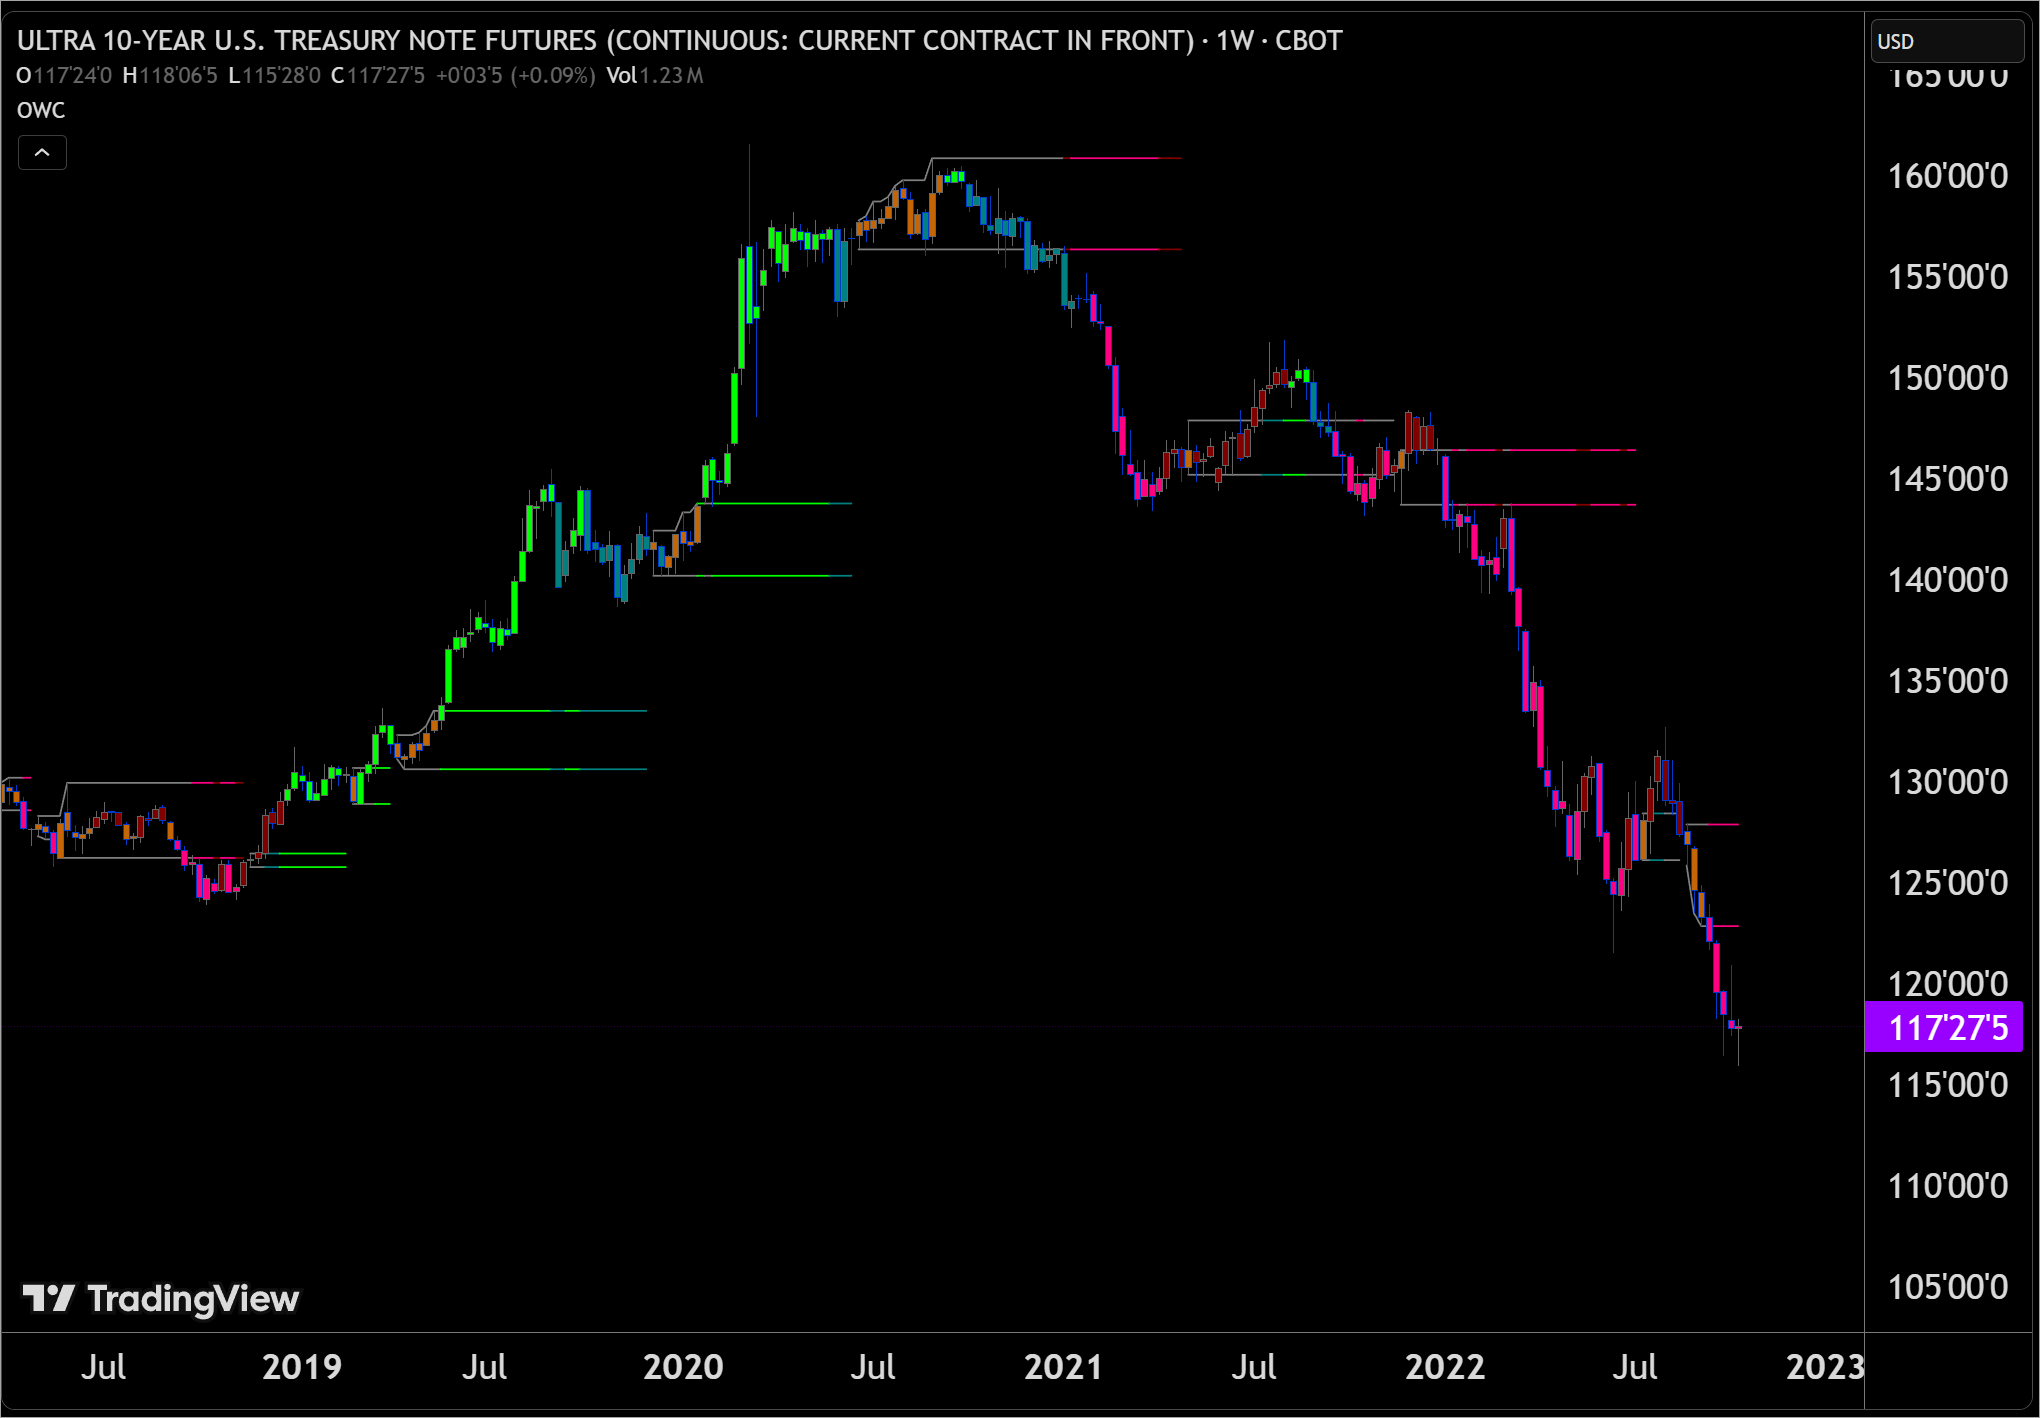
This indicator uses an on-chart visual framework to help traders with the interpretation of any oscillator's behavior. The advantage of using this tool is that you do not need to know all the ins and outs of a particular oscillator such as RSI, CCI, Stochastic, etc. Your choice of oscillator and settings in this indicator will change its visuals, which allows you to evaluate different configurations in the context of how the workbench models oscillator behavior.
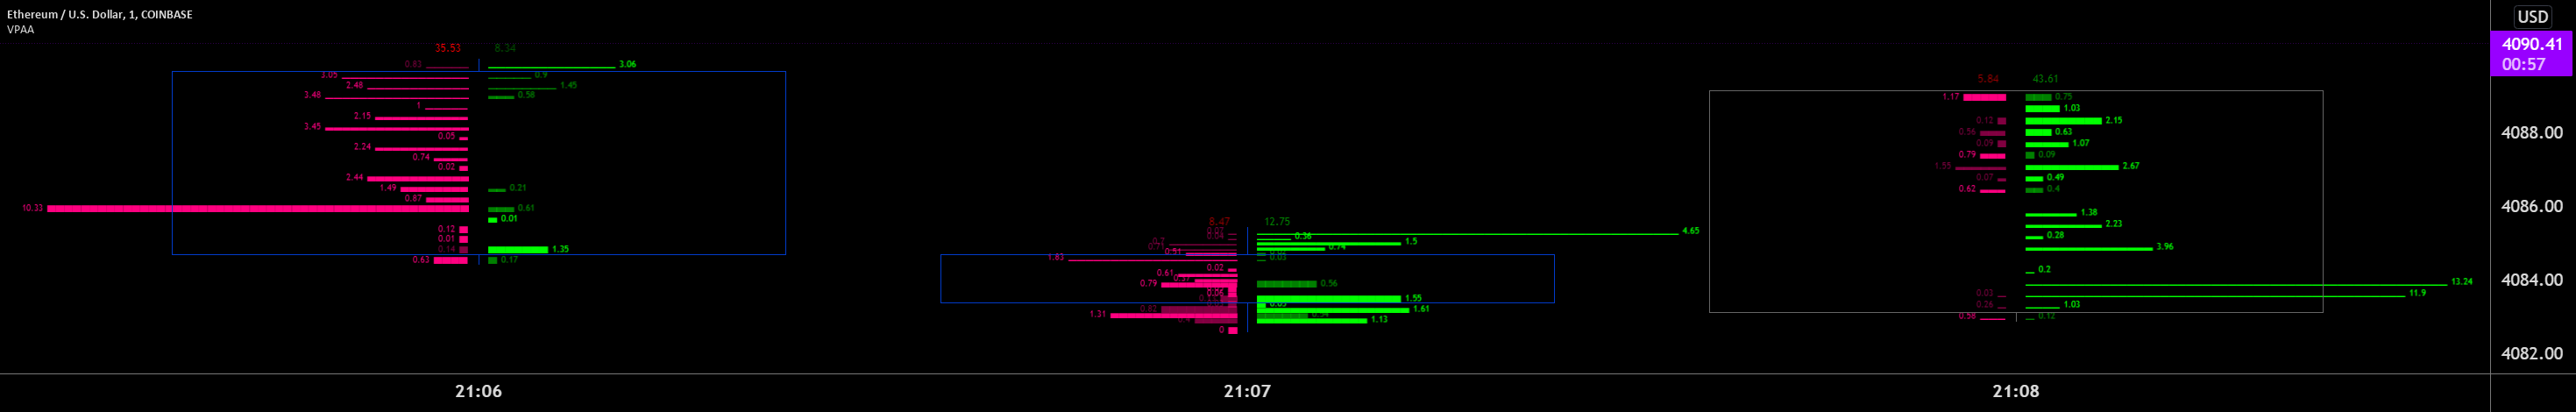
Realtime 5D Profile
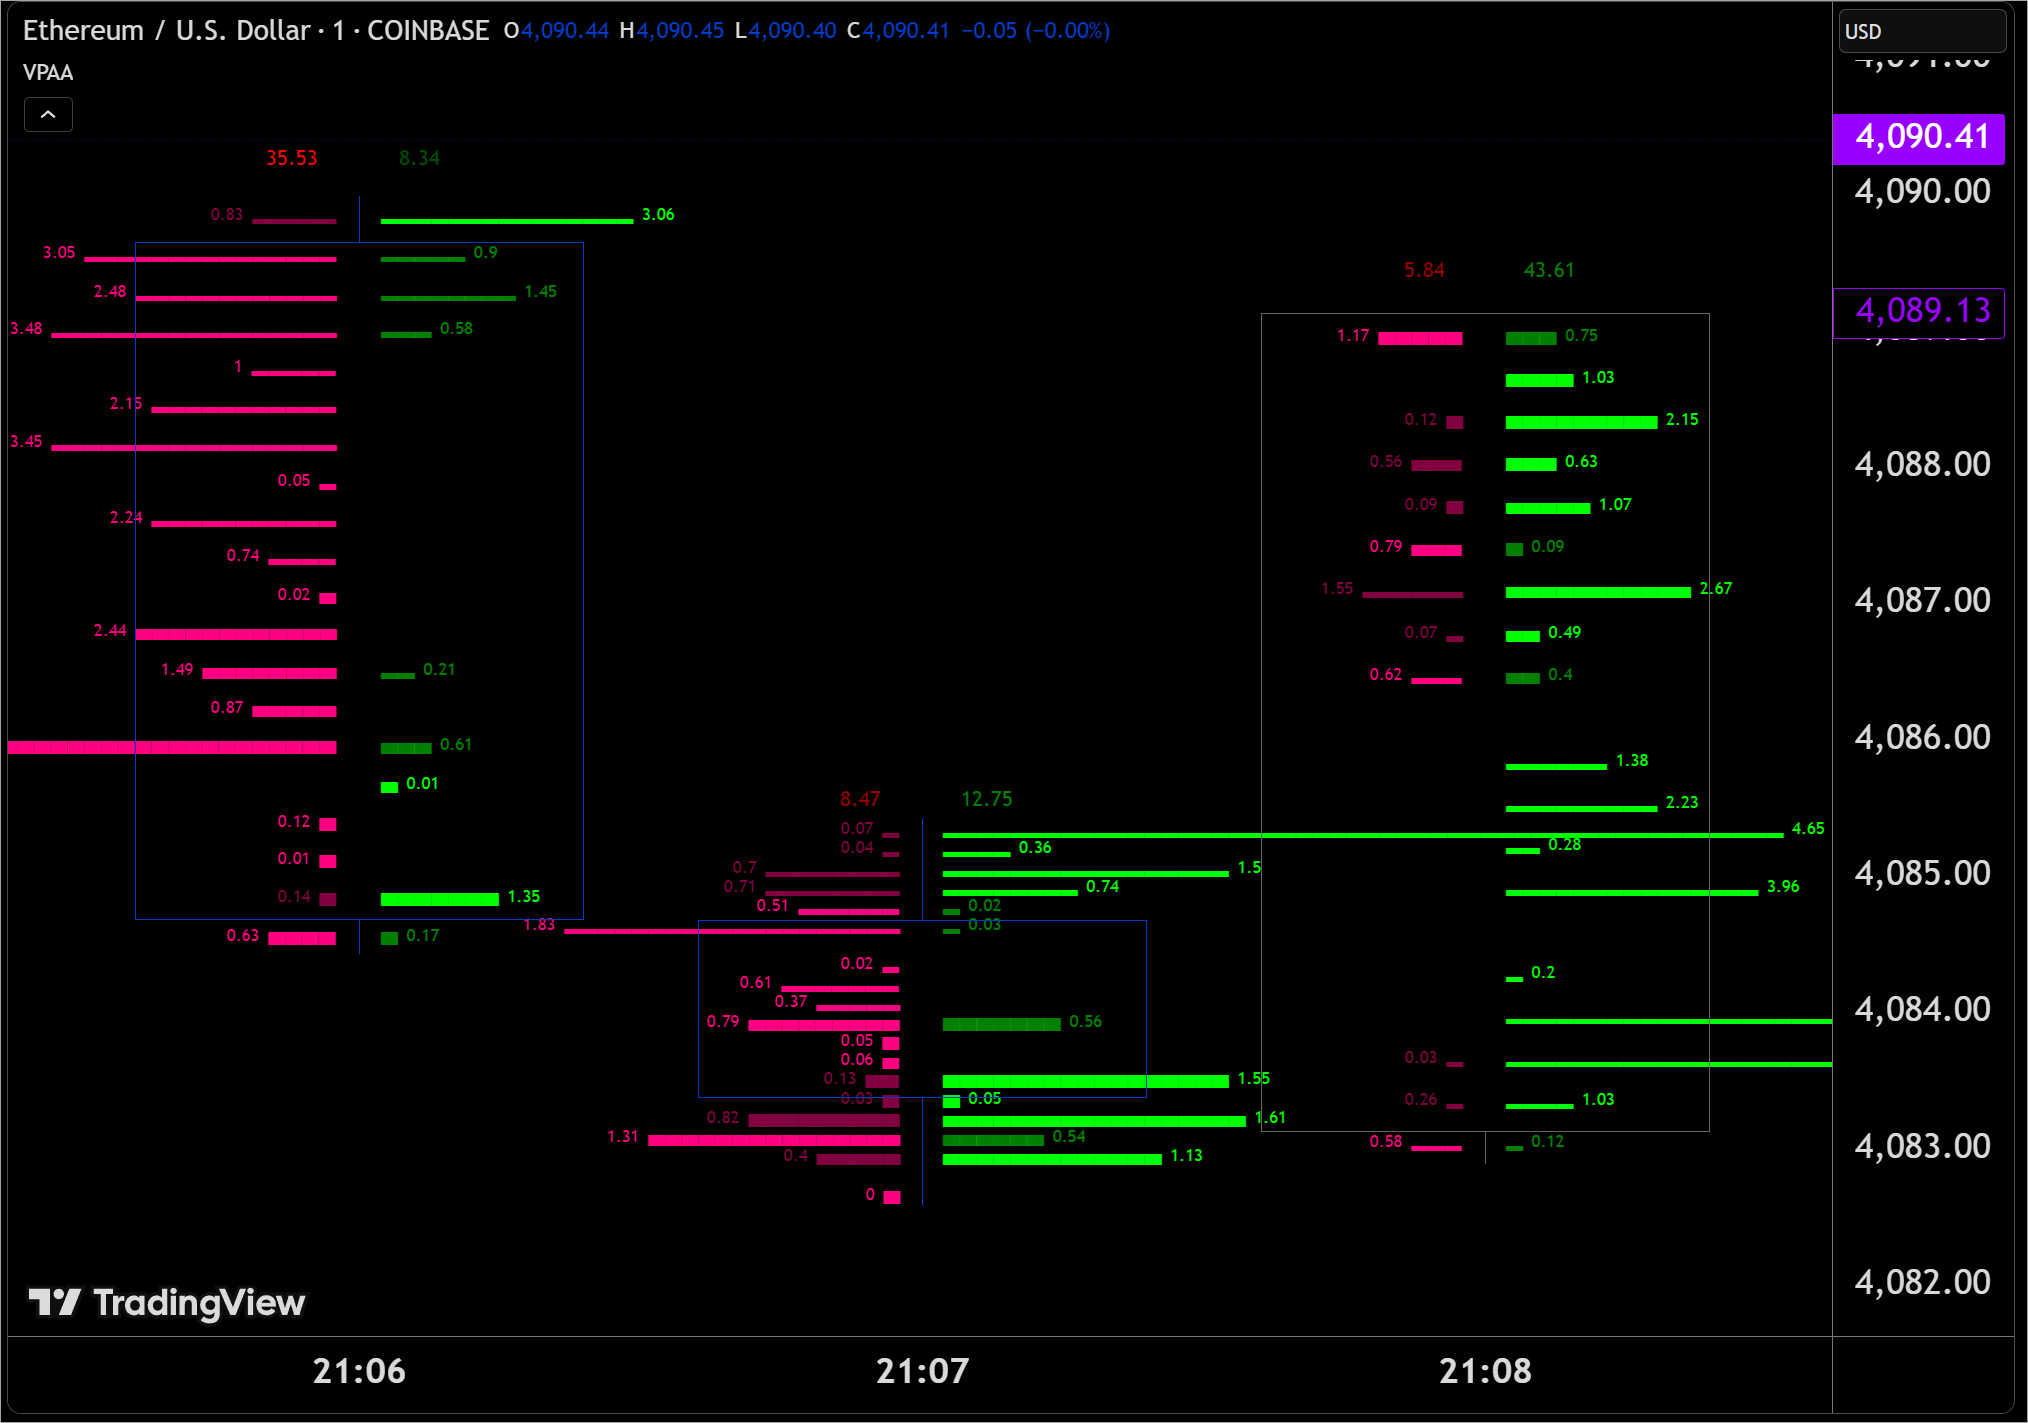
This indicator displays a realtime profile that can be configured to visualize five dimensions: volume, price, time, activity and age. For each price level in a bar or timeframe, you can display total or delta volume or ticks. The tick count measures activity on a level. The thickness of each level's line indicates its age, which helps you identify the most recent levels.
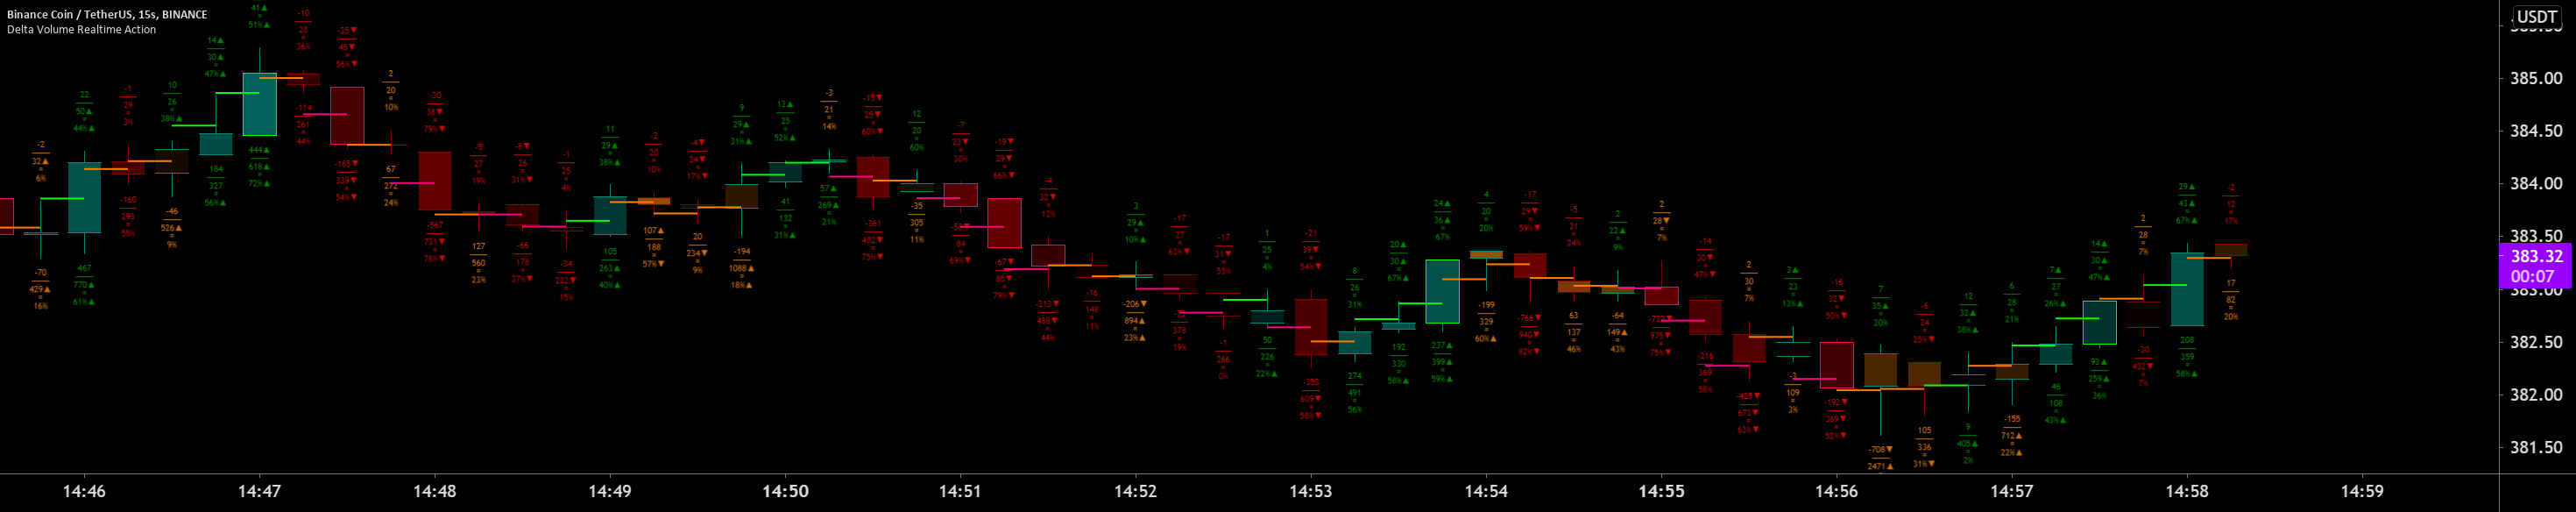
Realtime Delta Volume Action
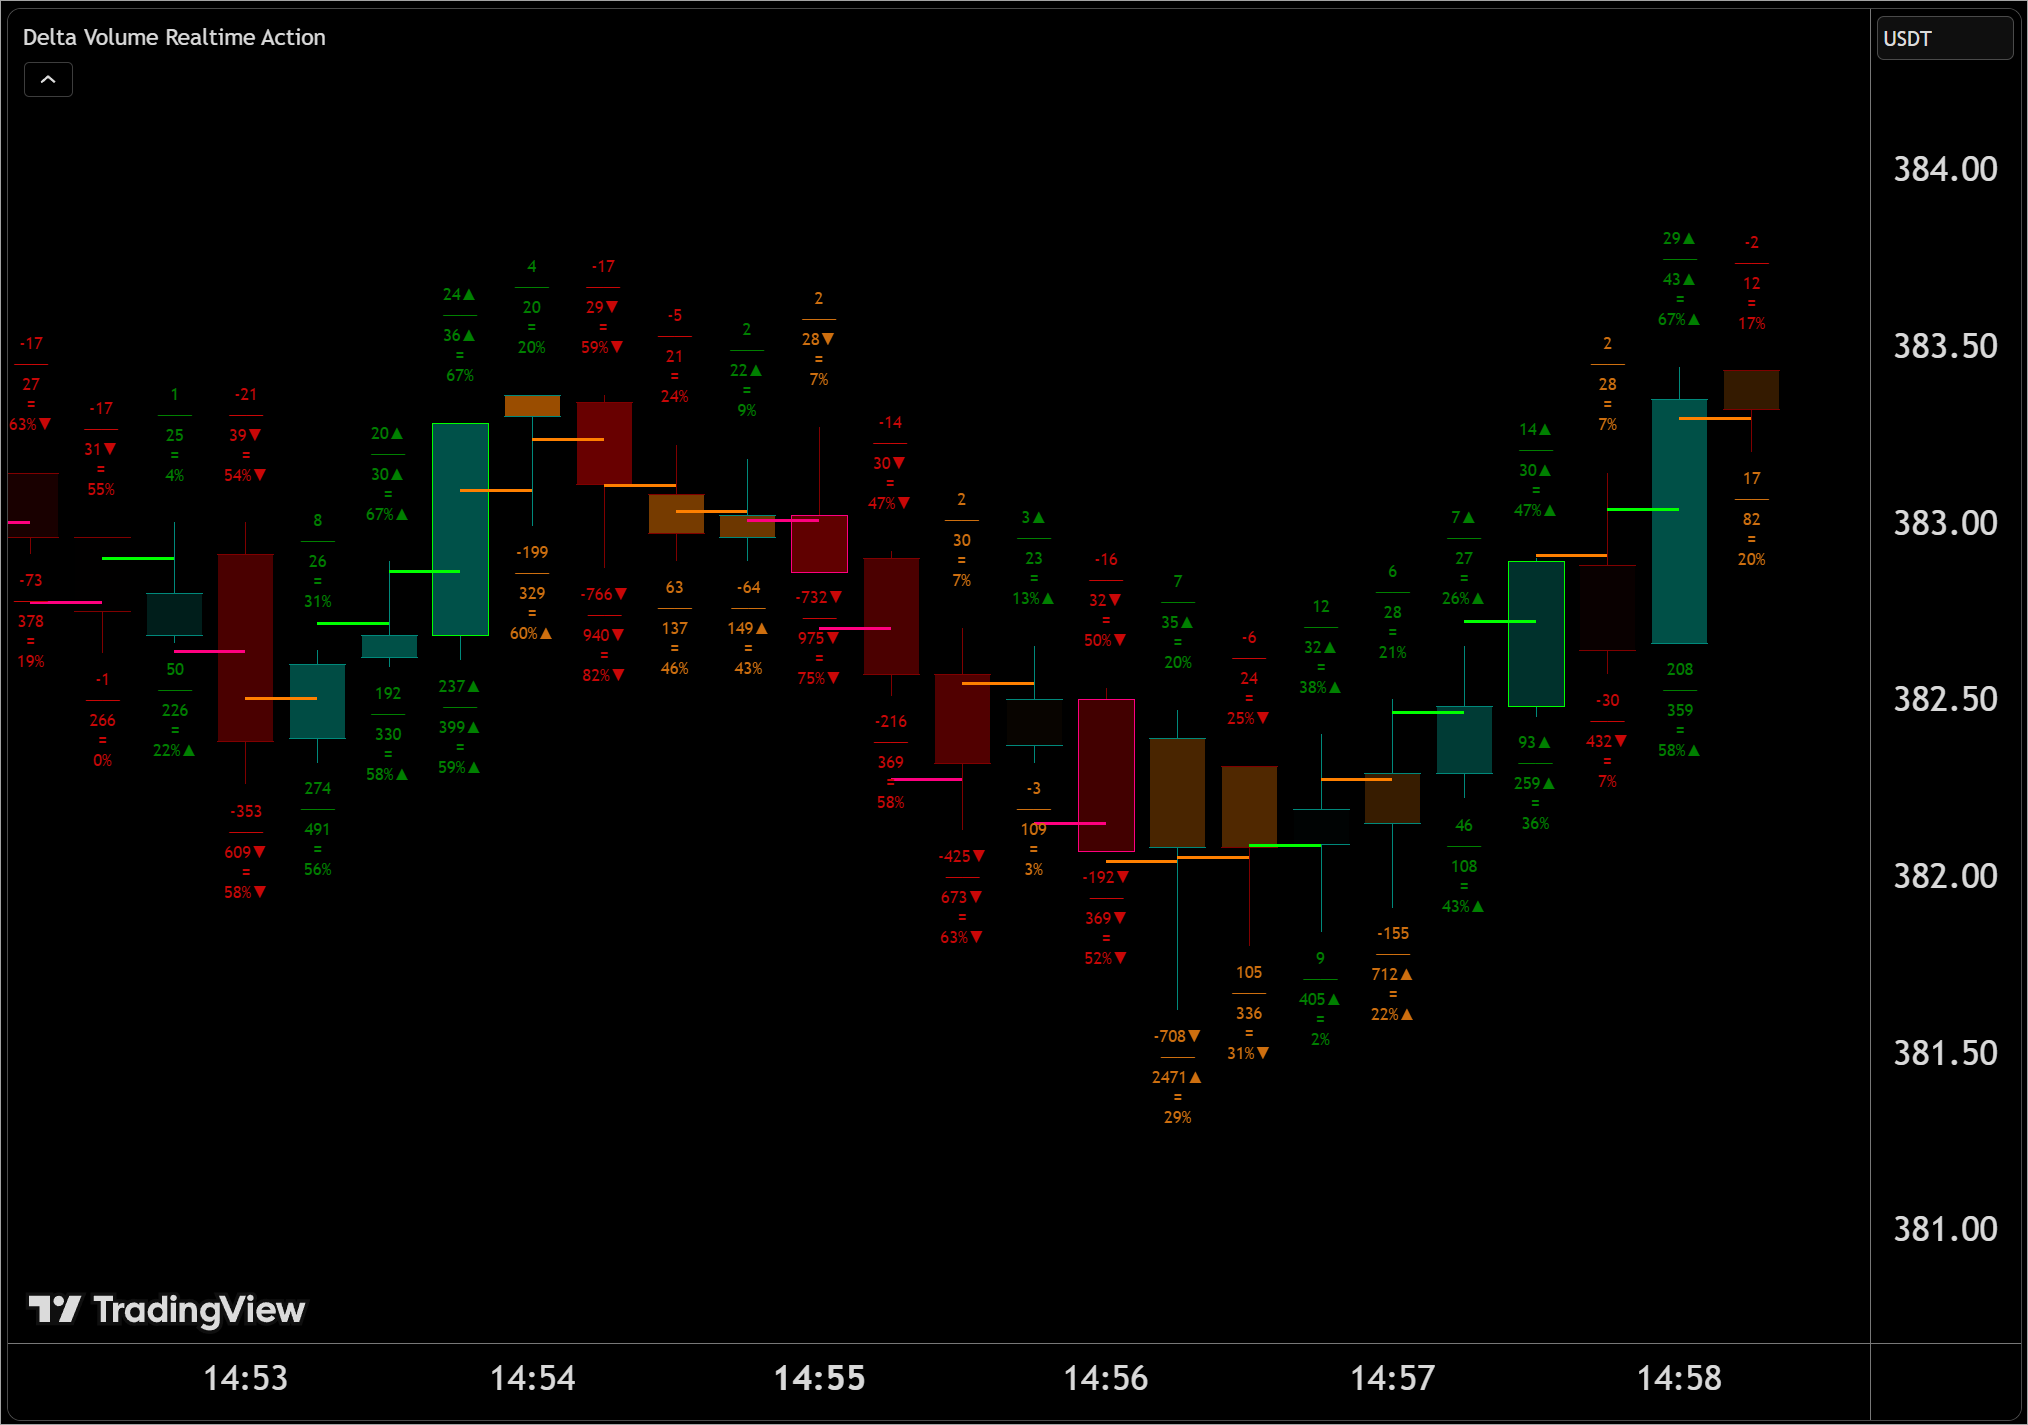
This indicator displays on-chart, realtime, delta volume and delta ticks information for each bar. It aims to provide traders who trade price action on small timeframes with volume and tick information gathered as updates come in the chart's feed. It builds its own candles, which are optimized to display volume delta information. It only works in realtime.
jdehorty
Renowned for bringing machine learning to the world of Pine, jdehorty is a trailblazer who makes complex ideas feel approachable. His scripts combine technical depth with thoughtful explanations, opening the door for others to explore more advanced techniques in Pine Script®. His work doesn’t just solve problems — it sparks curiosity and innovation.
With 11 published scripts and 26k followers, his scripts have become wildly popular among the TradingView community. Some of this most popular scripts include:
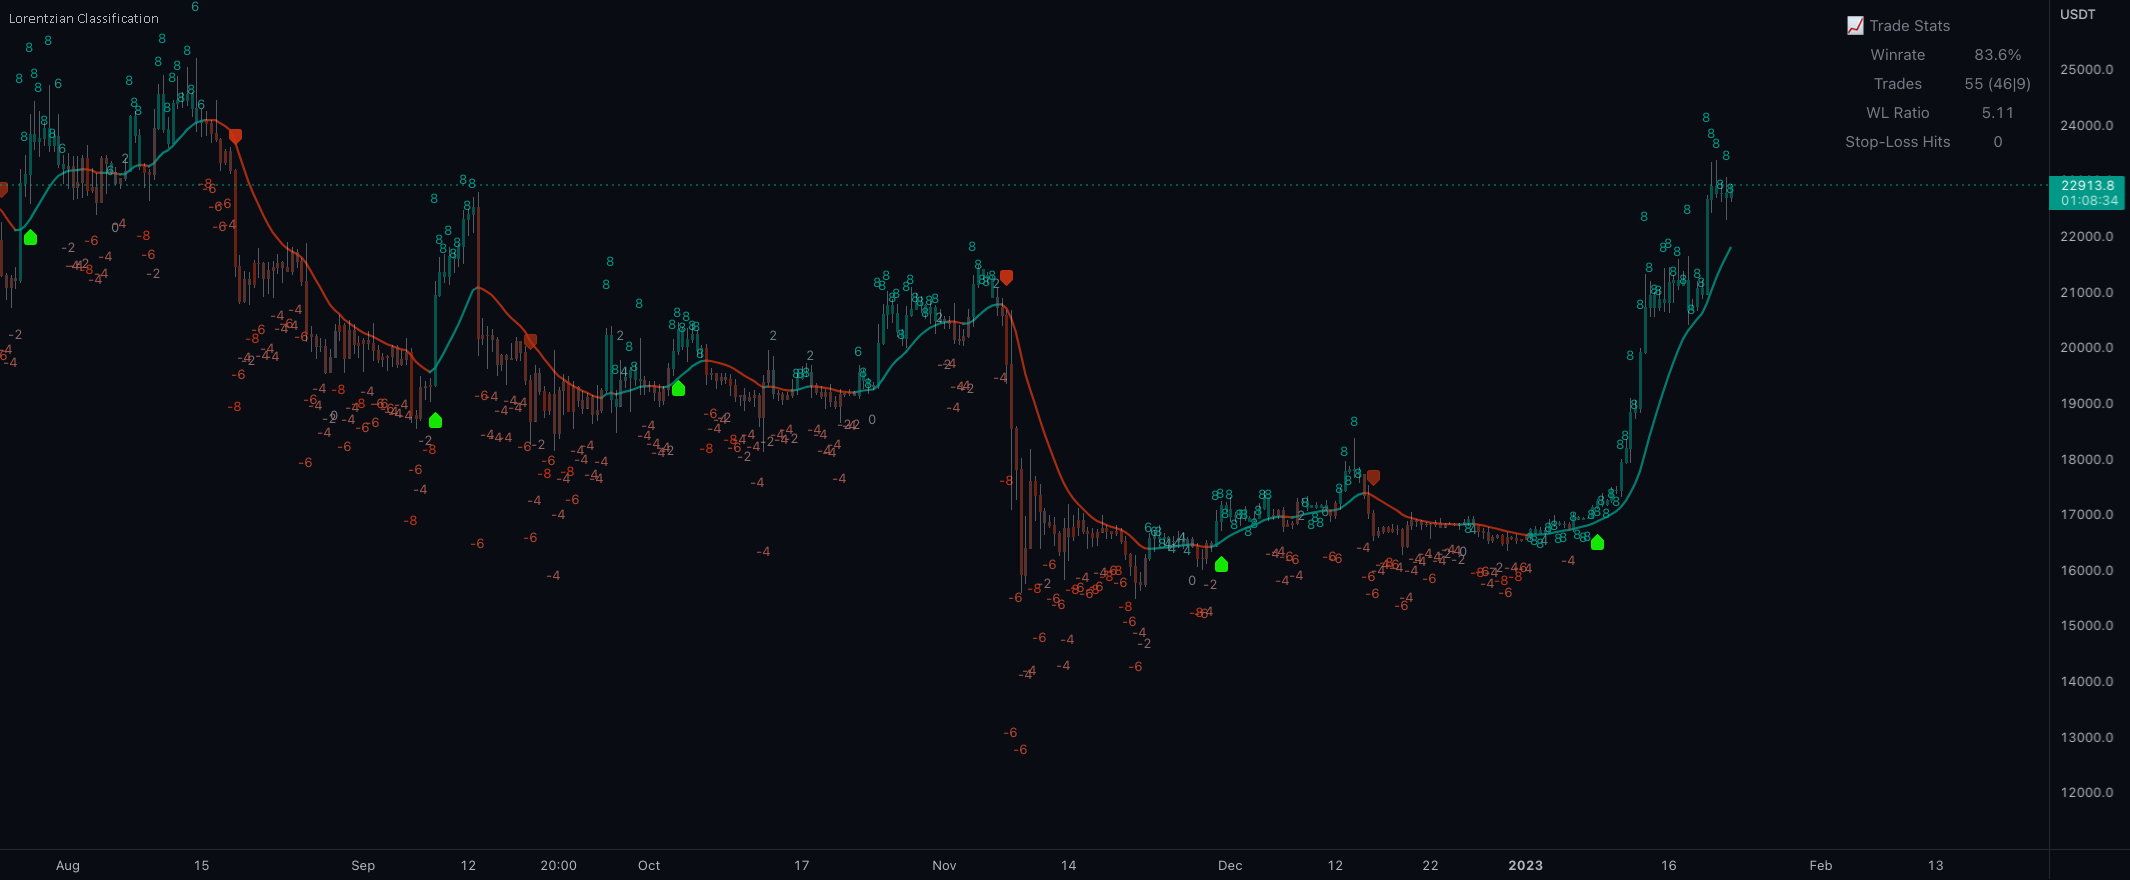
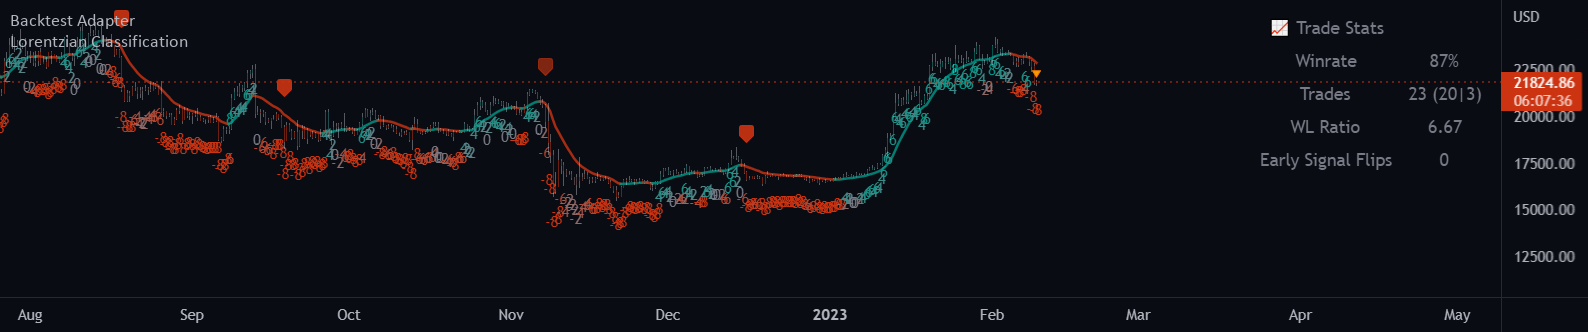
Machine Learning: Lorentzian Classification
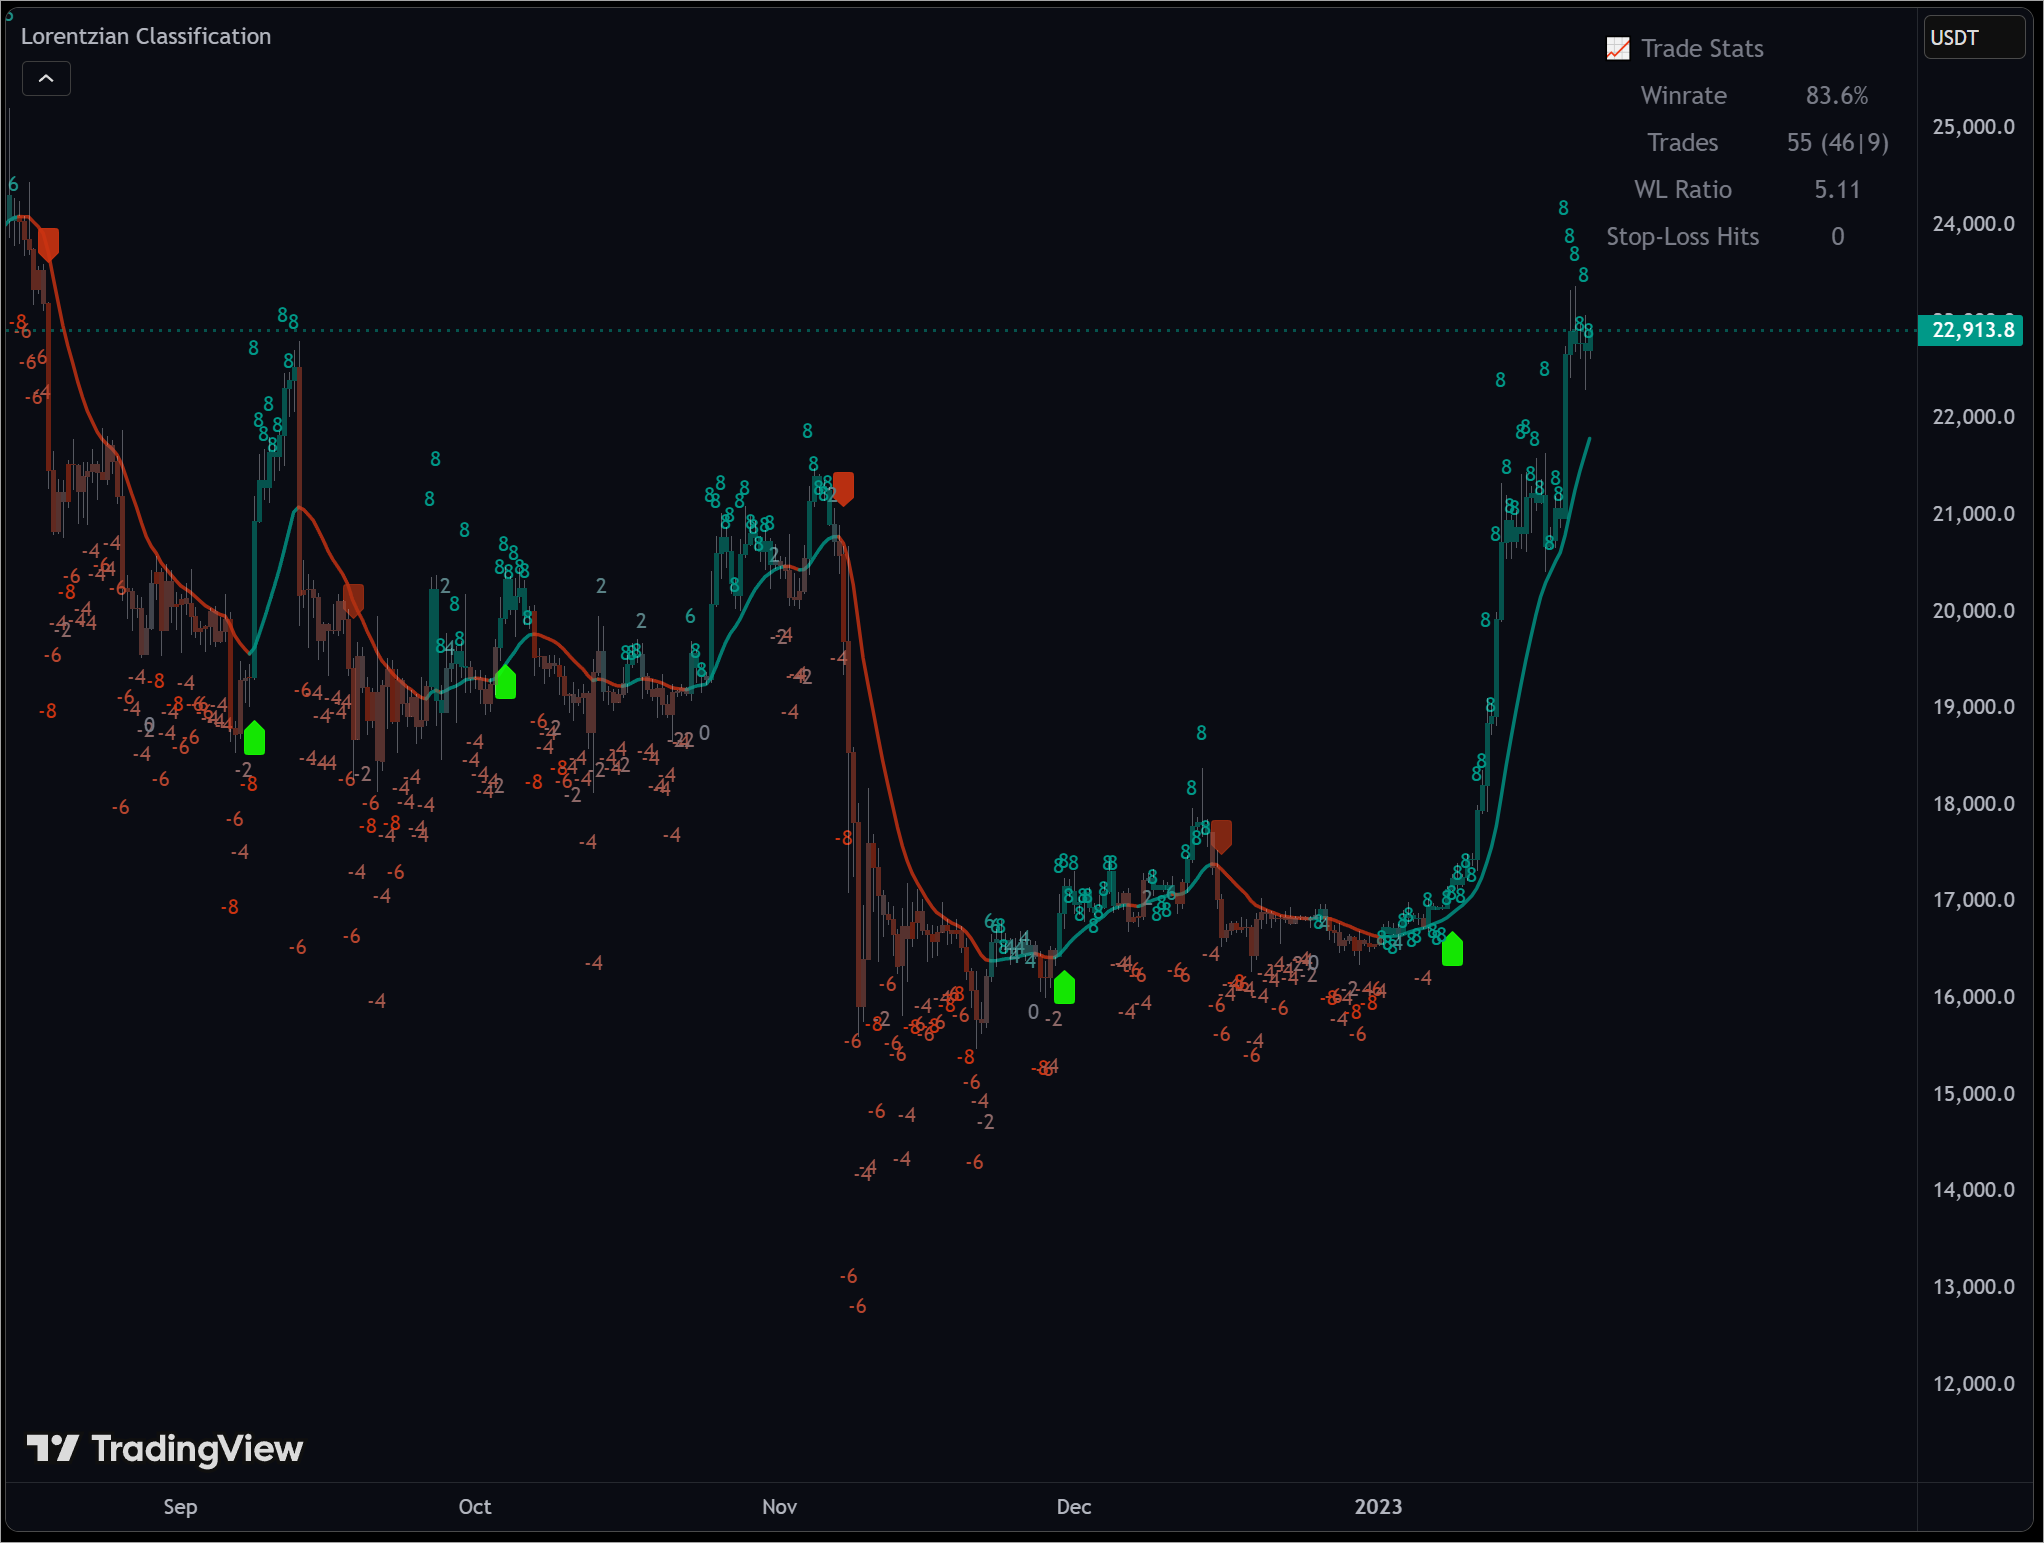
A Lorentzian Distance Classifier (LDC) is a Machine Learning classification algorithm capable of categorizing historical data from a multi-dimensional feature space. This indicator demonstrates how Lorentzian Classification can also be used to predict the direction of future price movements when used as the distance metric for a novel implementation of an Approximate Nearest Neighbors (ANN) algorithm.
Backtest Adapter
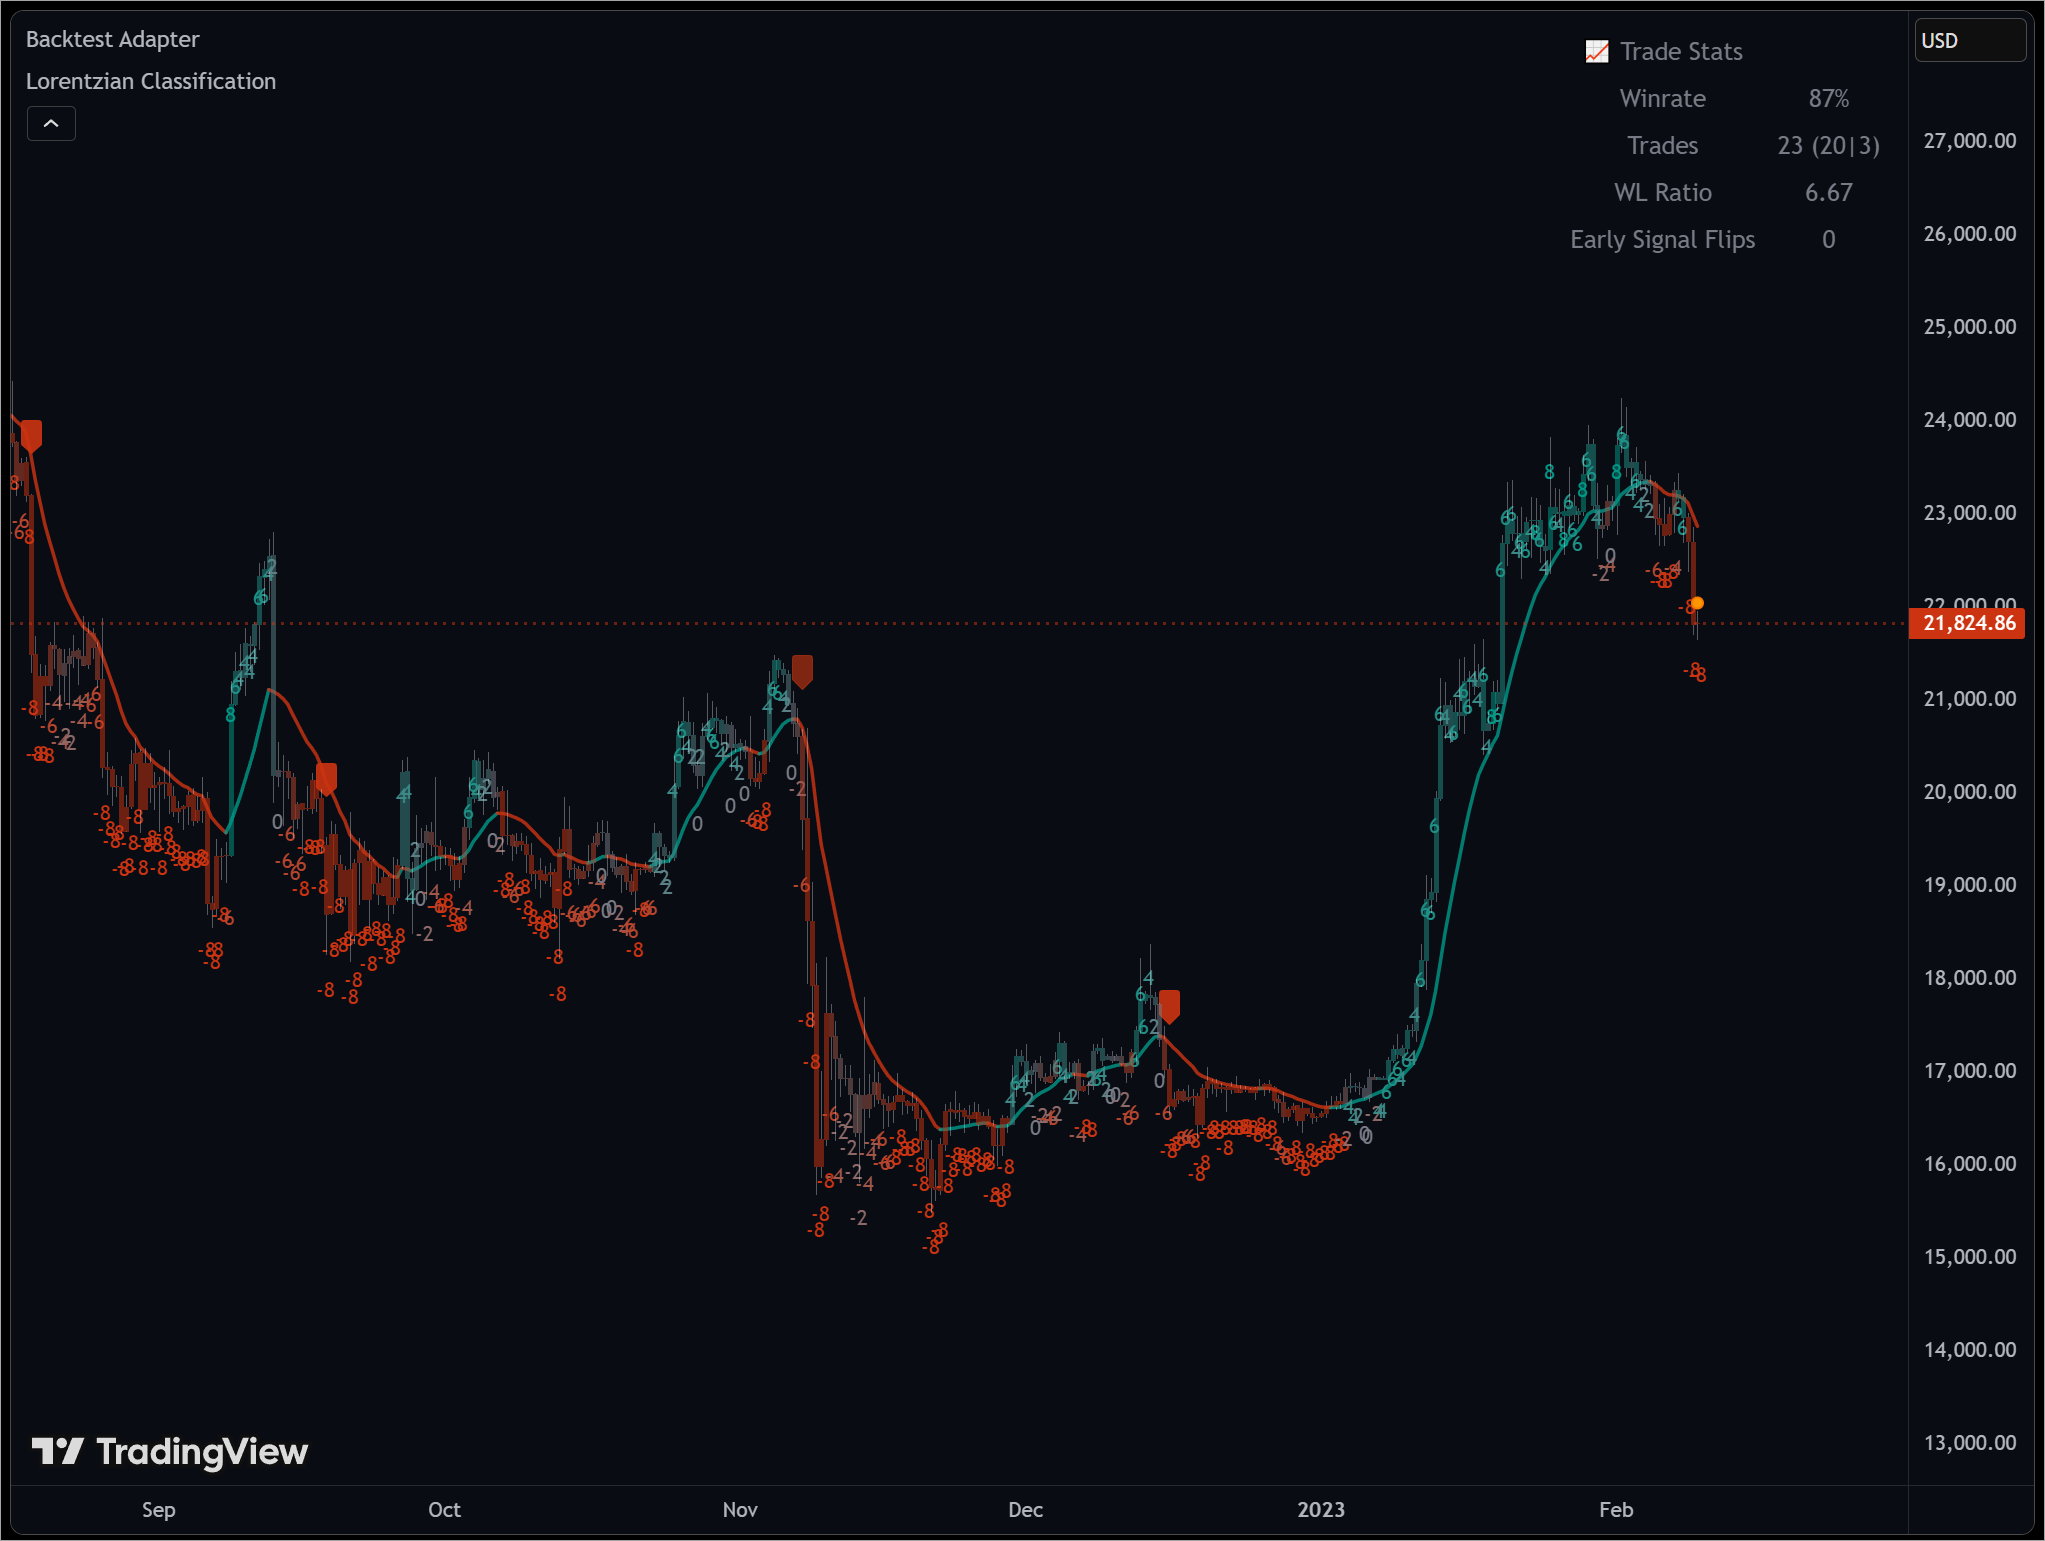
This adapter is helpful because it enables interactive backtesting with TradingView's built-in "Strategy Tester" framework without the need to translate the logic from an "indicator" script to a "strategy" script.
To use this, one must have the "Machine Learning: Lorentzian Classification" script and this Backtest Adapter open simultaneously on the same chart. From there, simply change the "Source" setting of the Backtest Adapter to "Lorentzian Classification: Backtest Stream" to transfer the entry/exit signals stream to the Backtest Adapter.
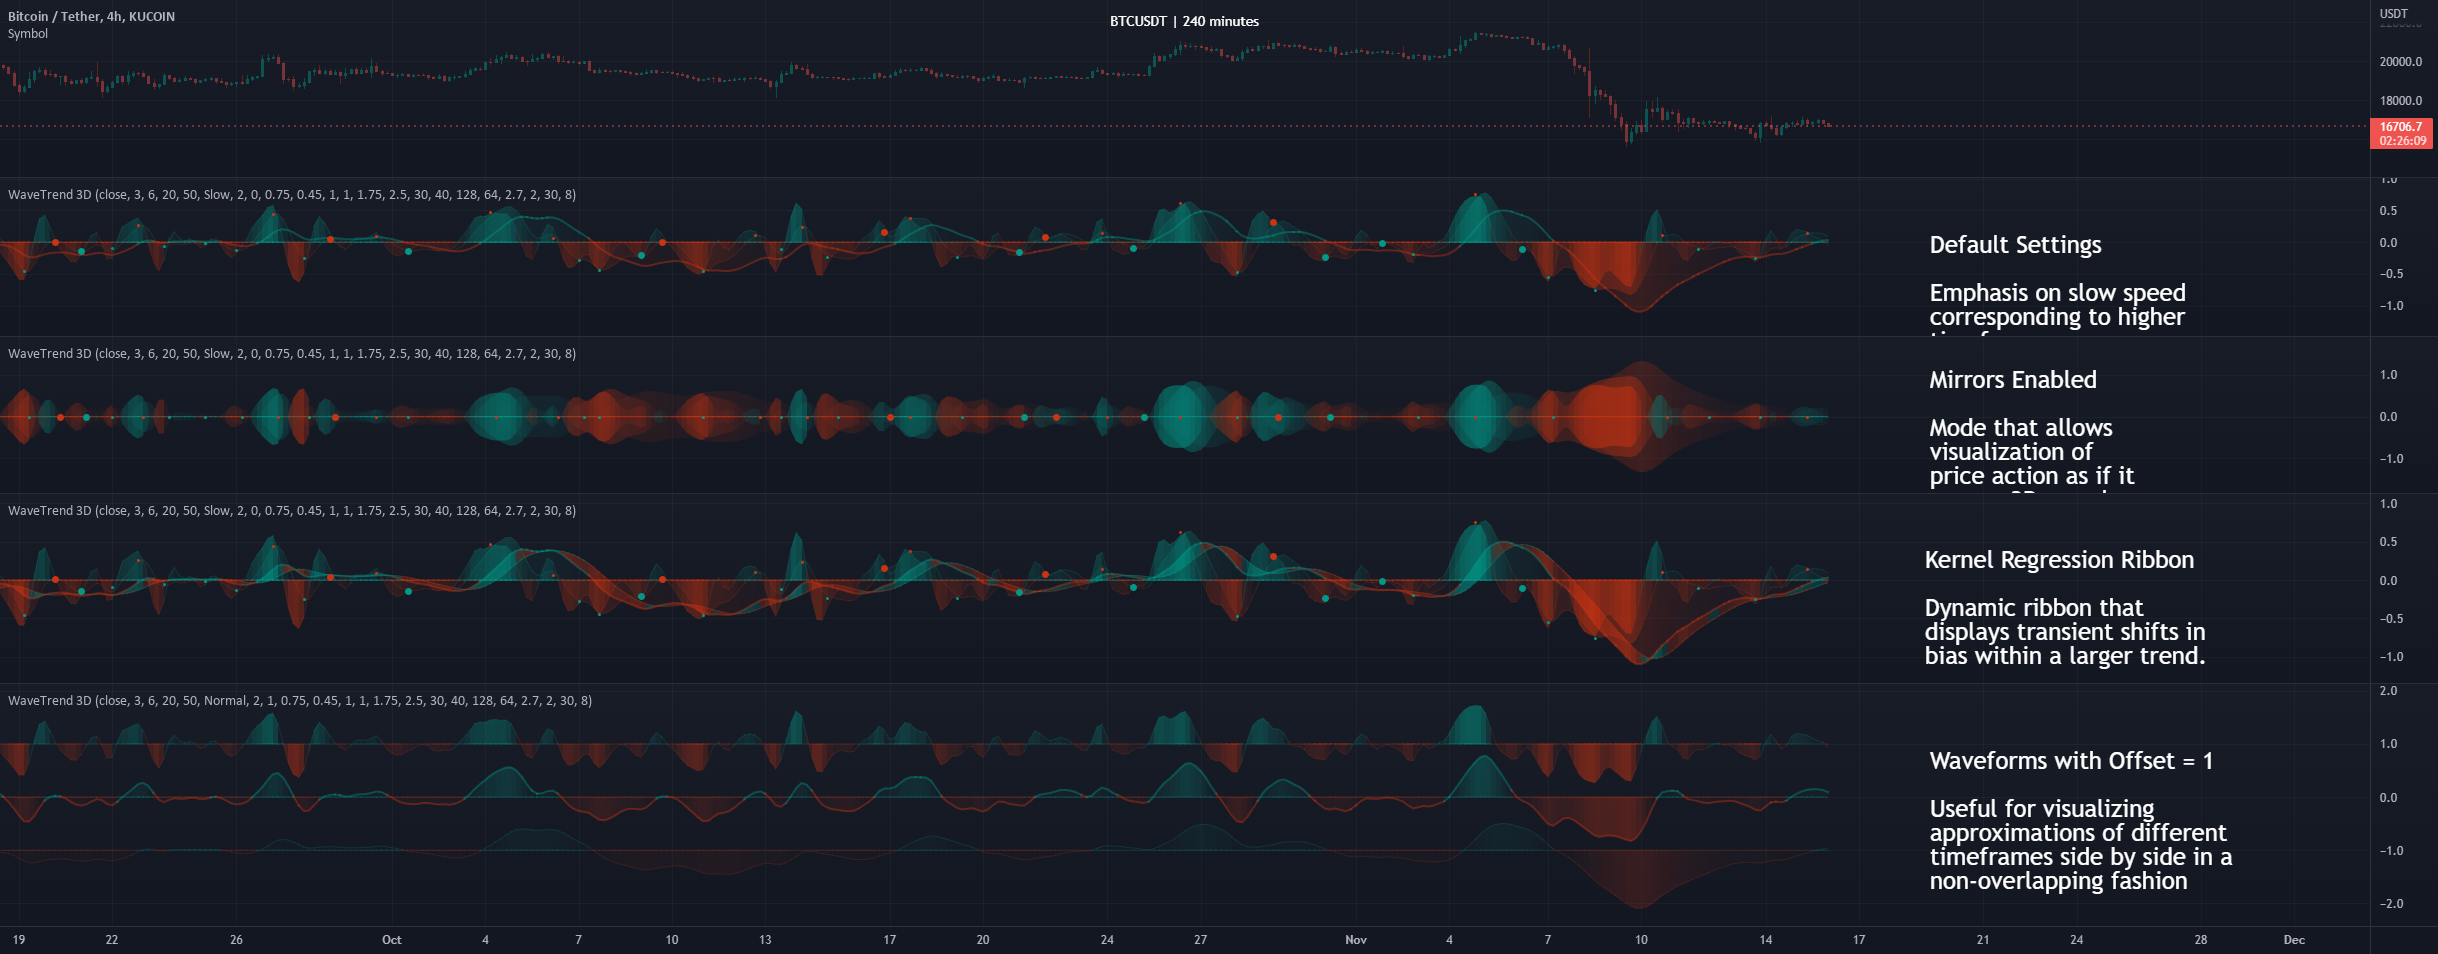
WaveTrend 3D
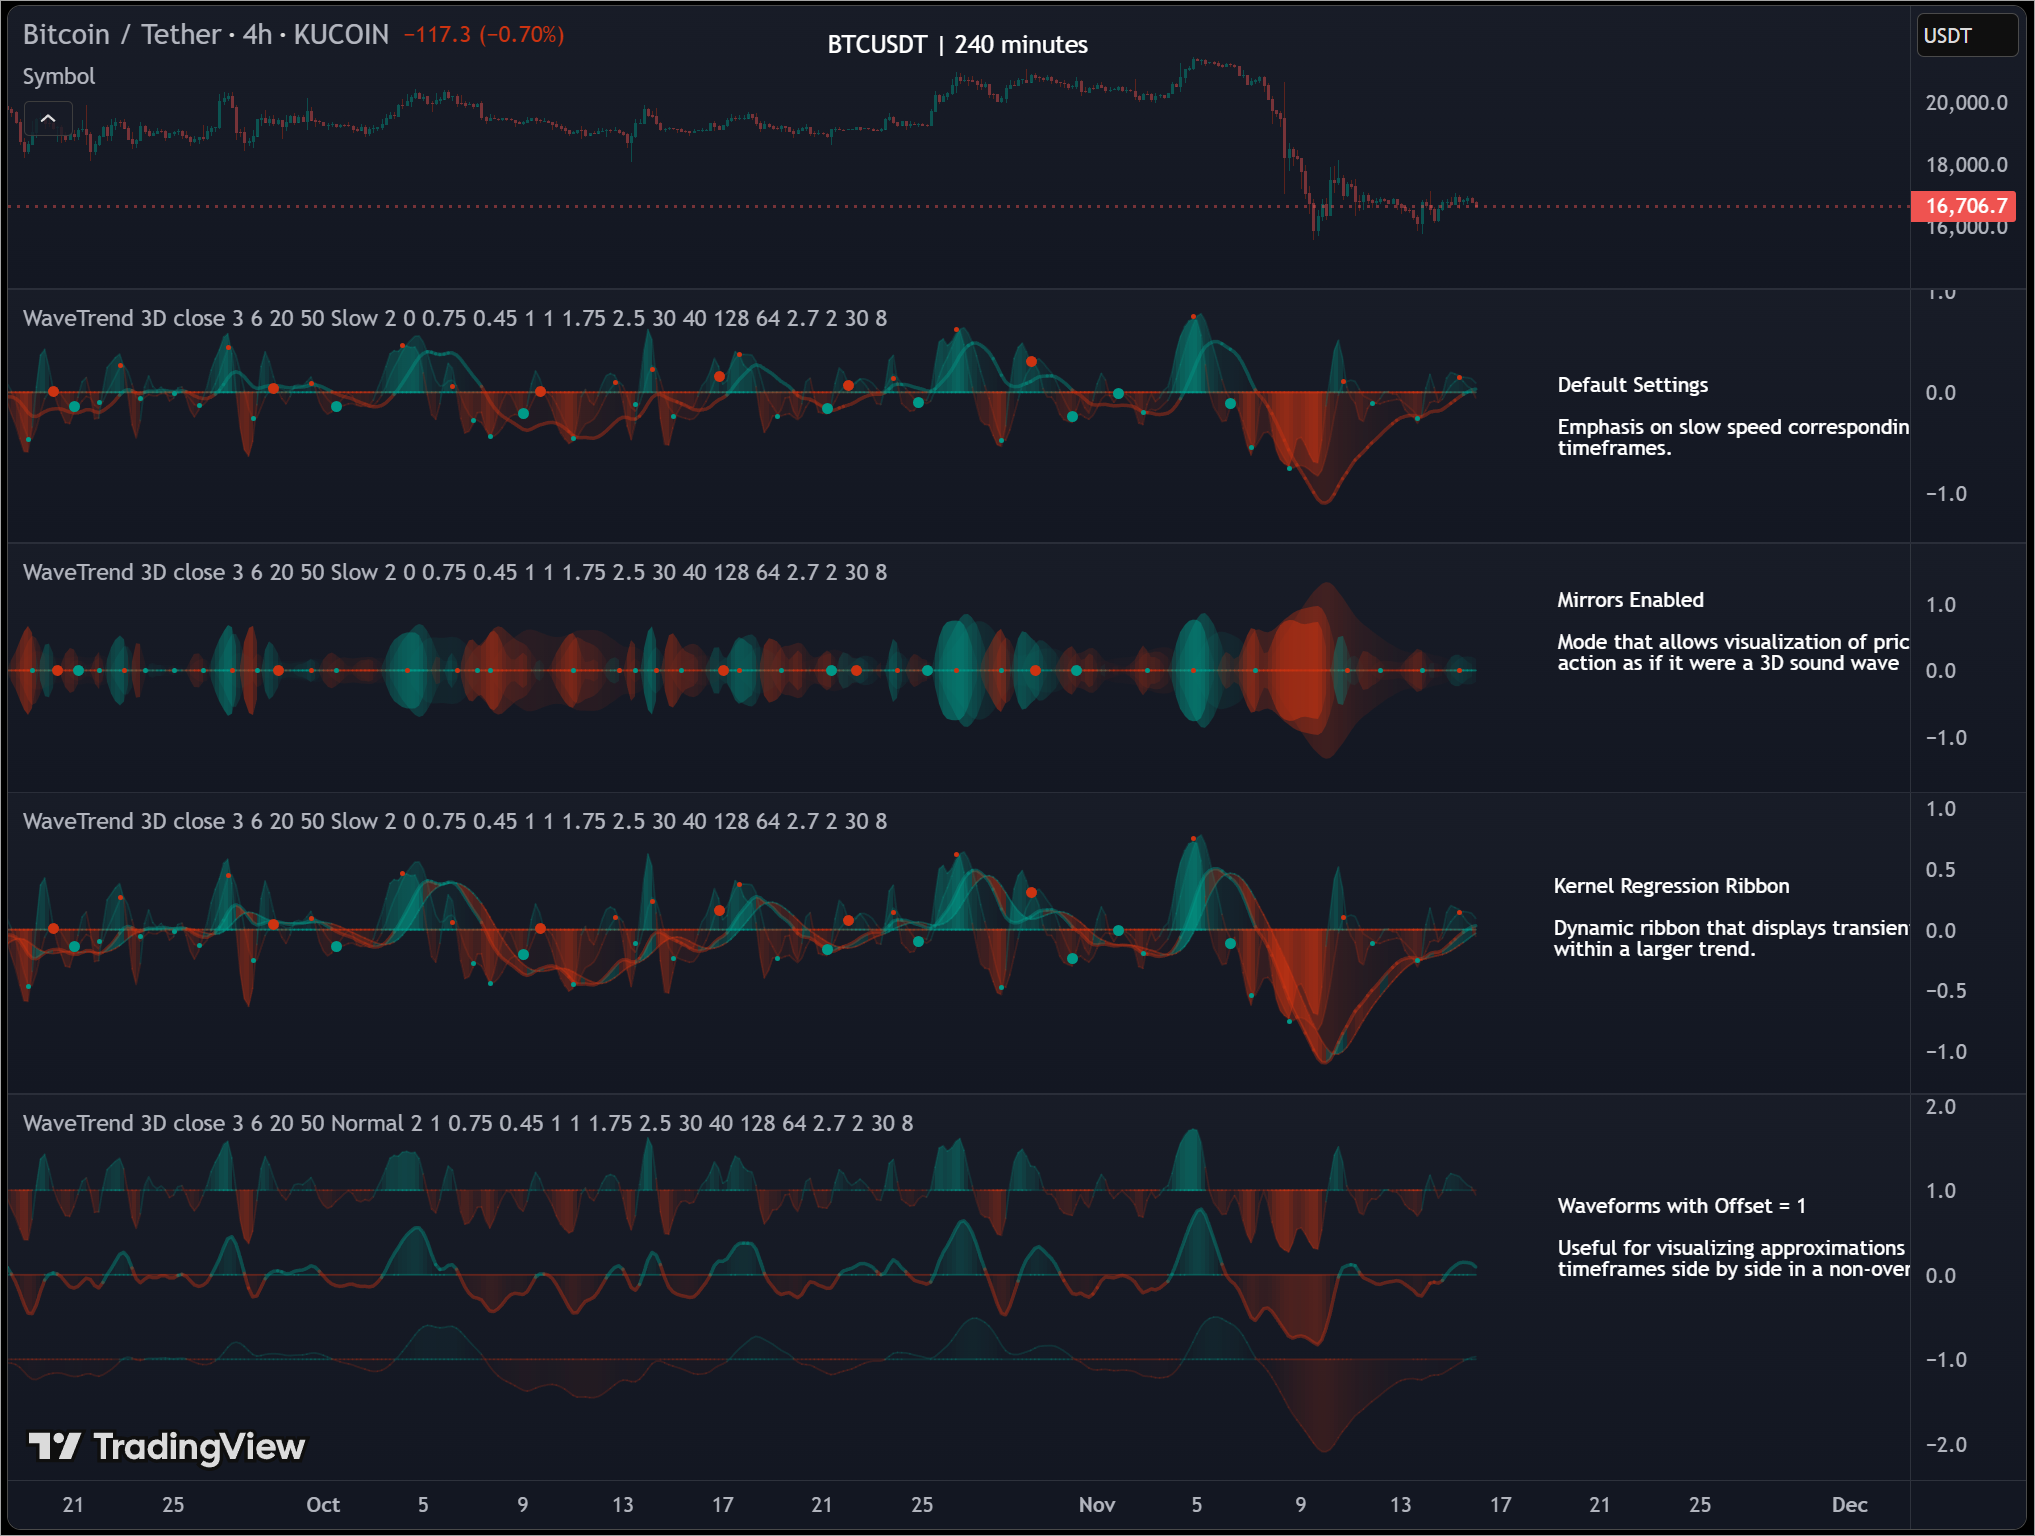
WaveTrend 3D (WT3D) is a novel implementation of the famous WaveTrend (WT) indicator and has been completely redesigned from the ground up to address some of the inherent shortcomings associated with the traditional WT algorithm.
kaigouthro
A true creative force, kaigouthro fuses functionality with design like few others. His indicators aren’t just helpful — they’re beautiful. With an eye for detail and a passion for open-source collaboration, he’s released a series of libraries and tools that help push the aesthetic and functional boundaries of what’s possible in Pine.
With 53 published scripts that push the boundary of for creative uses for Pine Script. Some of this most popular scripts include:
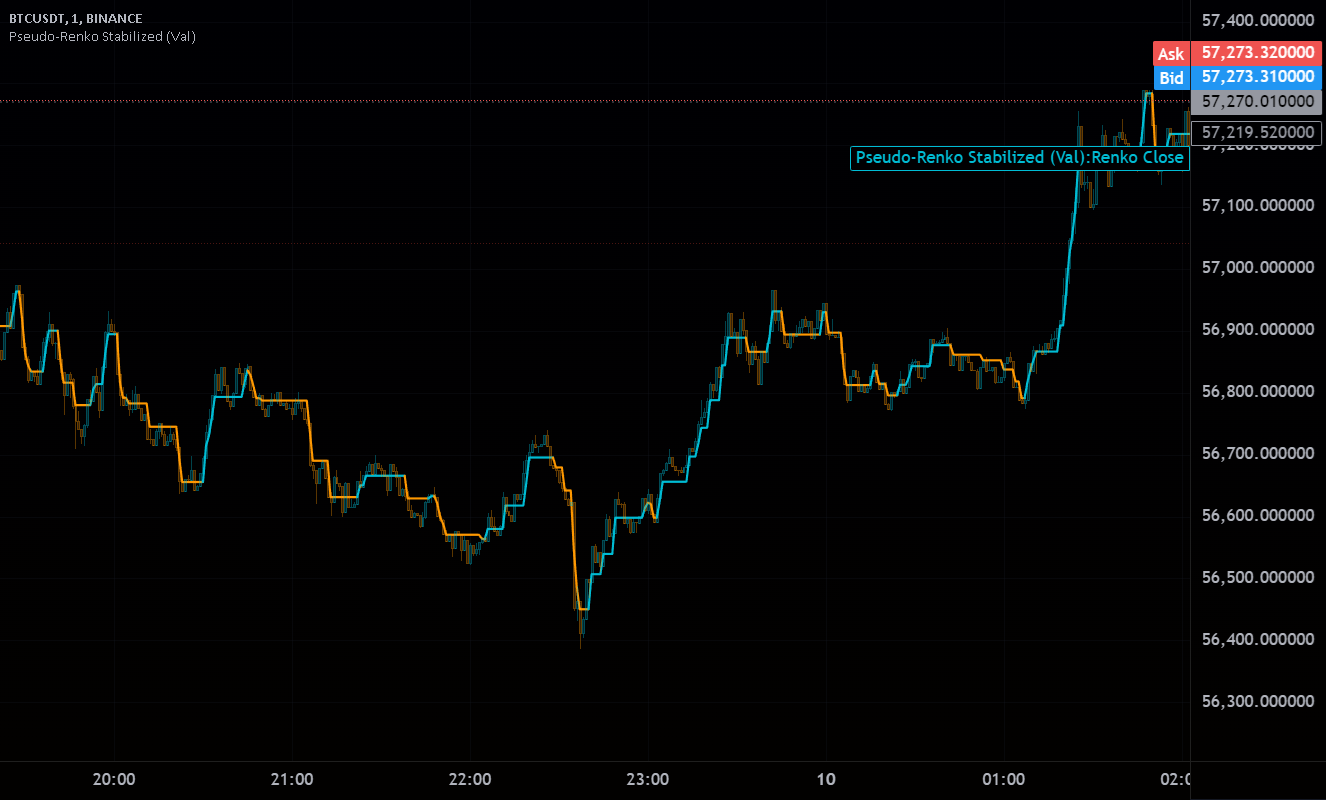
Pseudo-Renko Stabilized (Val)
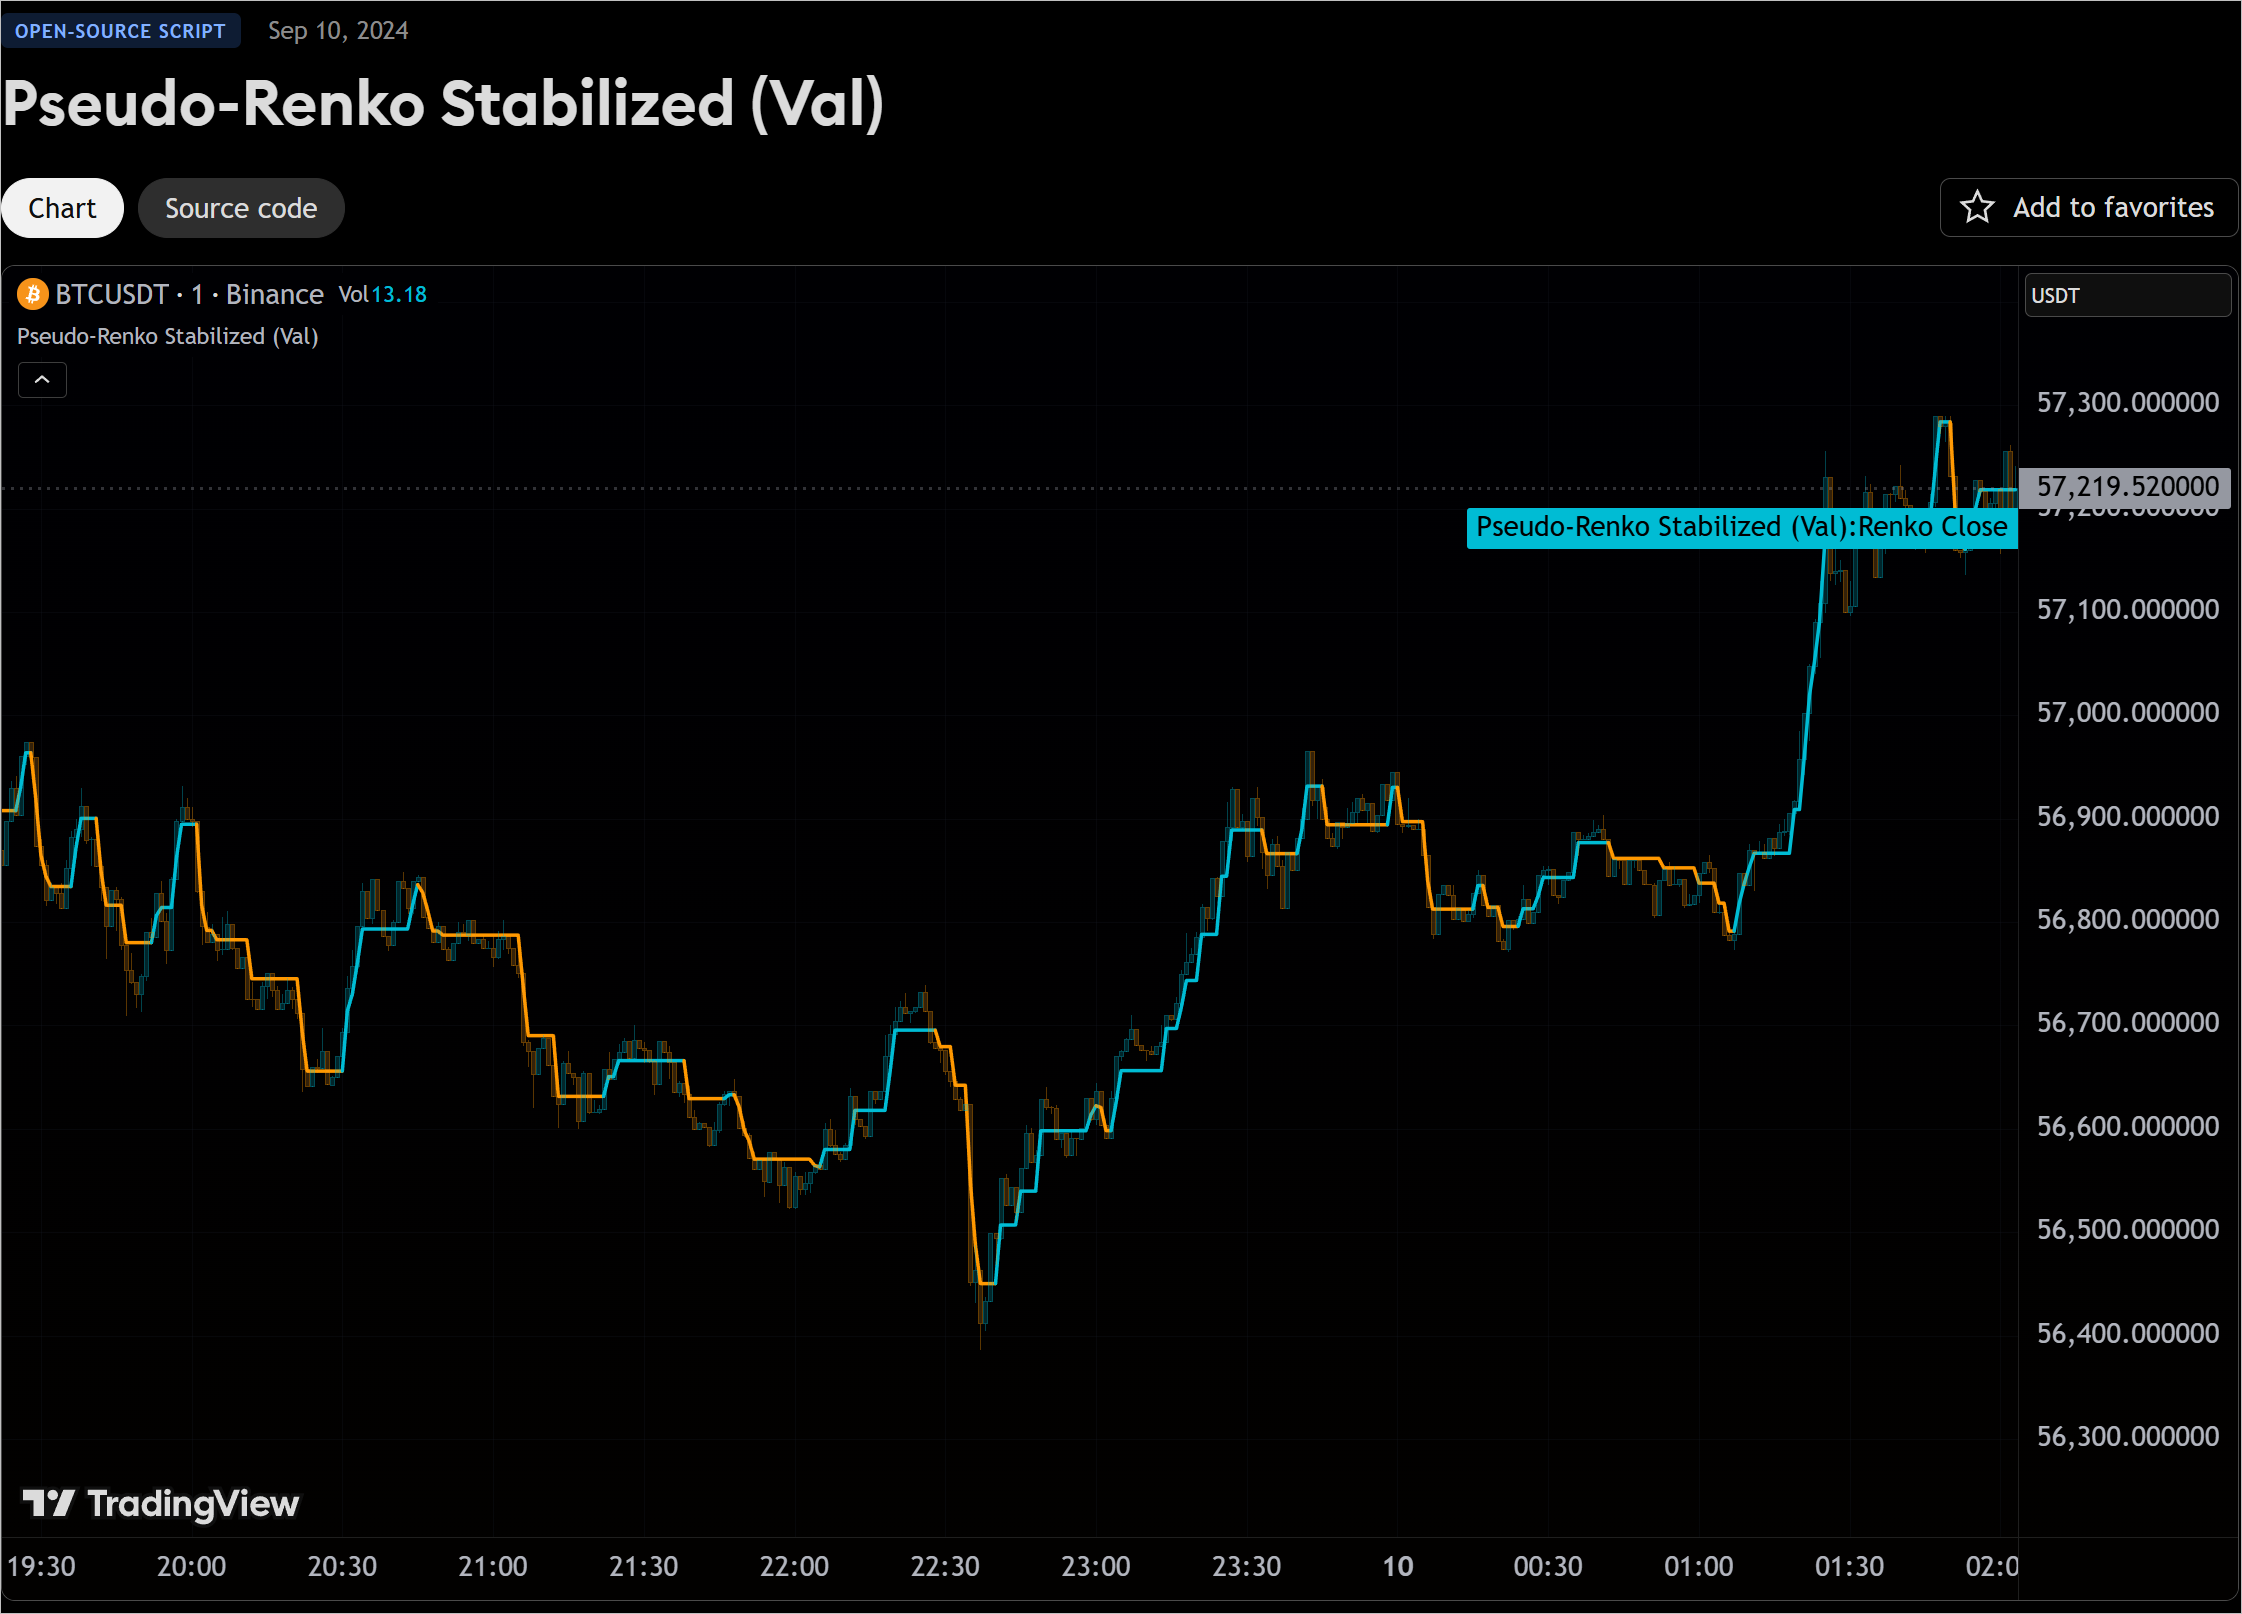
Calculates and returns the Pseudo-Renko Stabilized value (or close price) based on a given input value, along with the direction of the current Renko brick. This function adapts the traditional Renko brick size dynamically based on the volatility of the input value using a combination of SMA and EMA calculations. The calculated price represents the closing price of the most recent Pseudo-Renko brick, while the direction indicates the trend (1 for uptrend, -1 for downtrend).
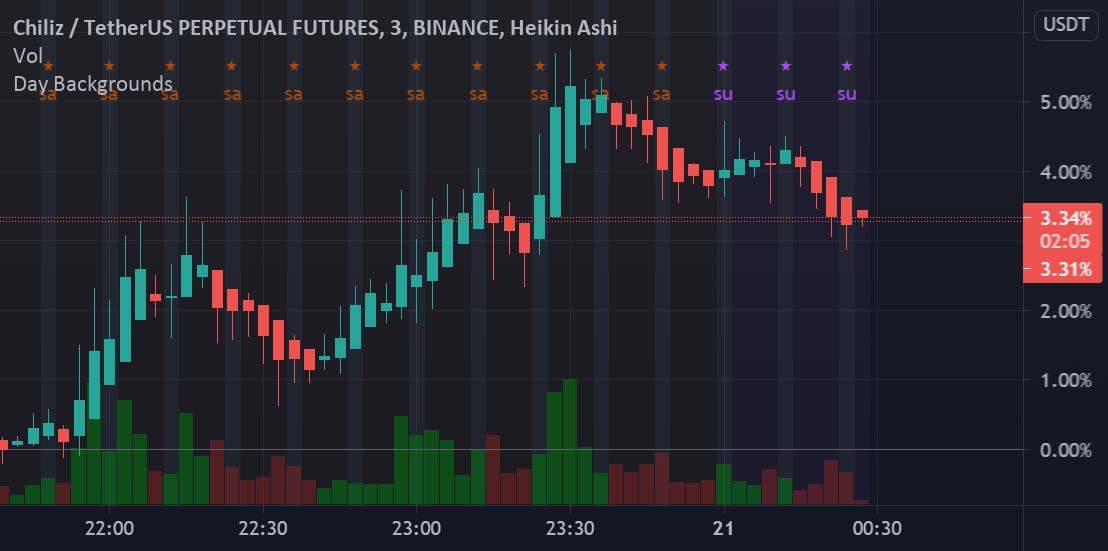
Days Colorized

Very Simple study script to colorize every day of the month a unique color, with stripes on Saturday and Sunday, and small text at the top to note the current day of the week. Currently set to GMT-7, feel free to change it to your own time zone. Thanks to all the pine coders out there for the inspiration and massive thanks to the open-source community for all the things I learn from playing with your scripts.
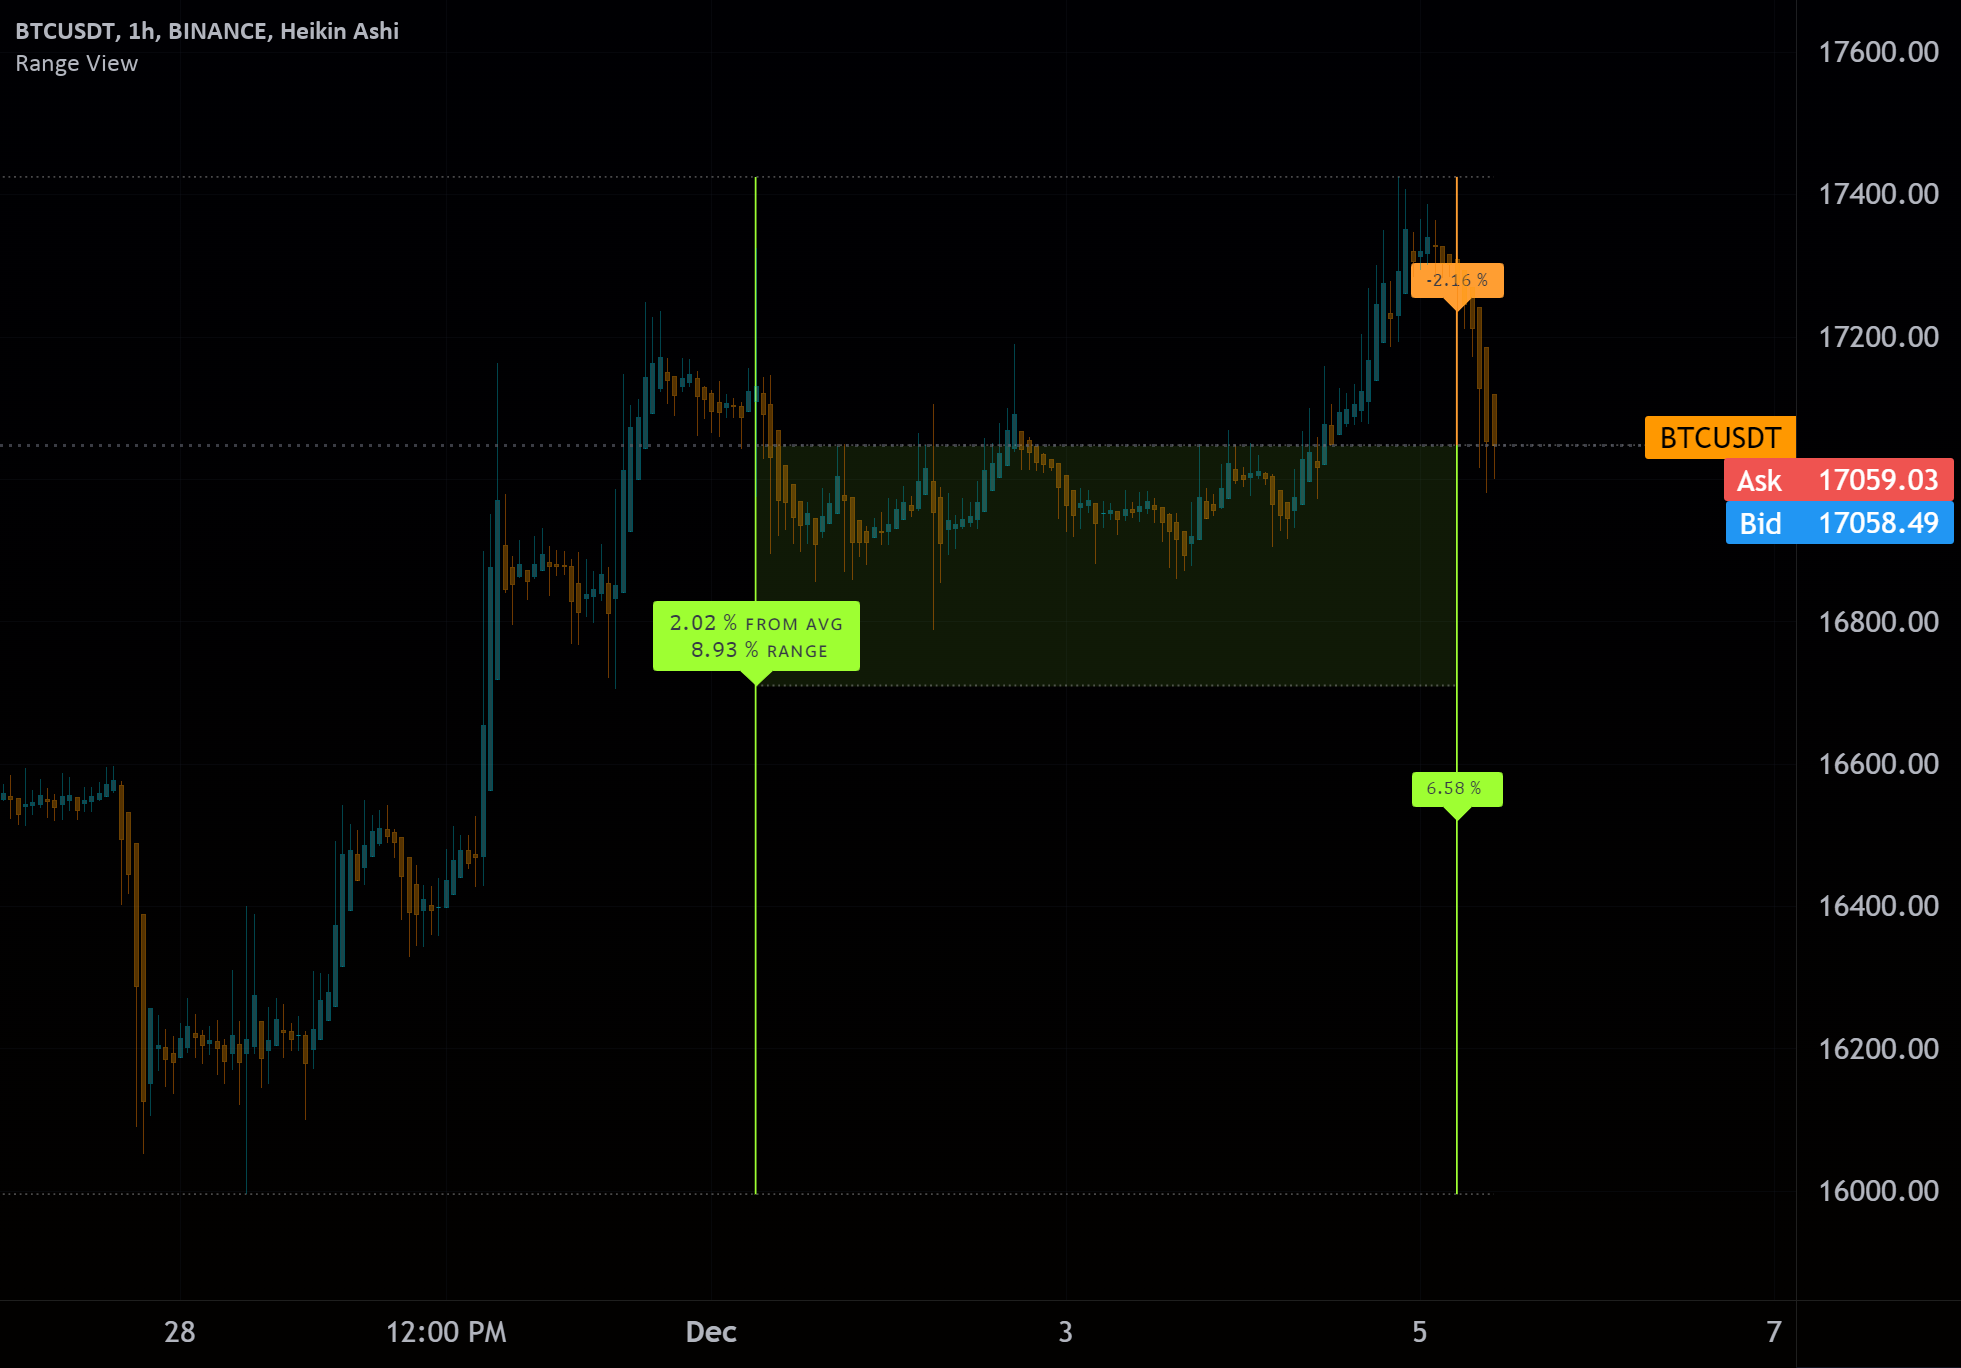
Visible Range

A quick and easy "at a glance" display for the viewable candles. It does repaint, but that is a non-issue, as it is simply a quick and handy tool to visually see a quick peek at the visible range. The highest, lowest, and average are displayed, with labels for the percentage distance from the current close value and total range. Automatic color for each based on relative distance for consistency in stable or volatile conditions.
Final Thoughts
Once again, we want to congratulate this year’s Pine Script® Wizards and thank them for their generosity, talent, and impact. If you haven’t already explored their work, we encourage you to dive in — you’ll find no shortage of inspiration.
Want to automate signals from any of these indicators? CrossTrade turns TradingView alerts into executed orders on NinjaTrader 8. Here's how to set up your first automation.