A Modern NinjaTrader 8 Journal Built to Help Get You Funded
Review NinjaTrader and Tradovate fills with calendar and performance tools. Free journal access is separate from subscription-based automatic broker capture.

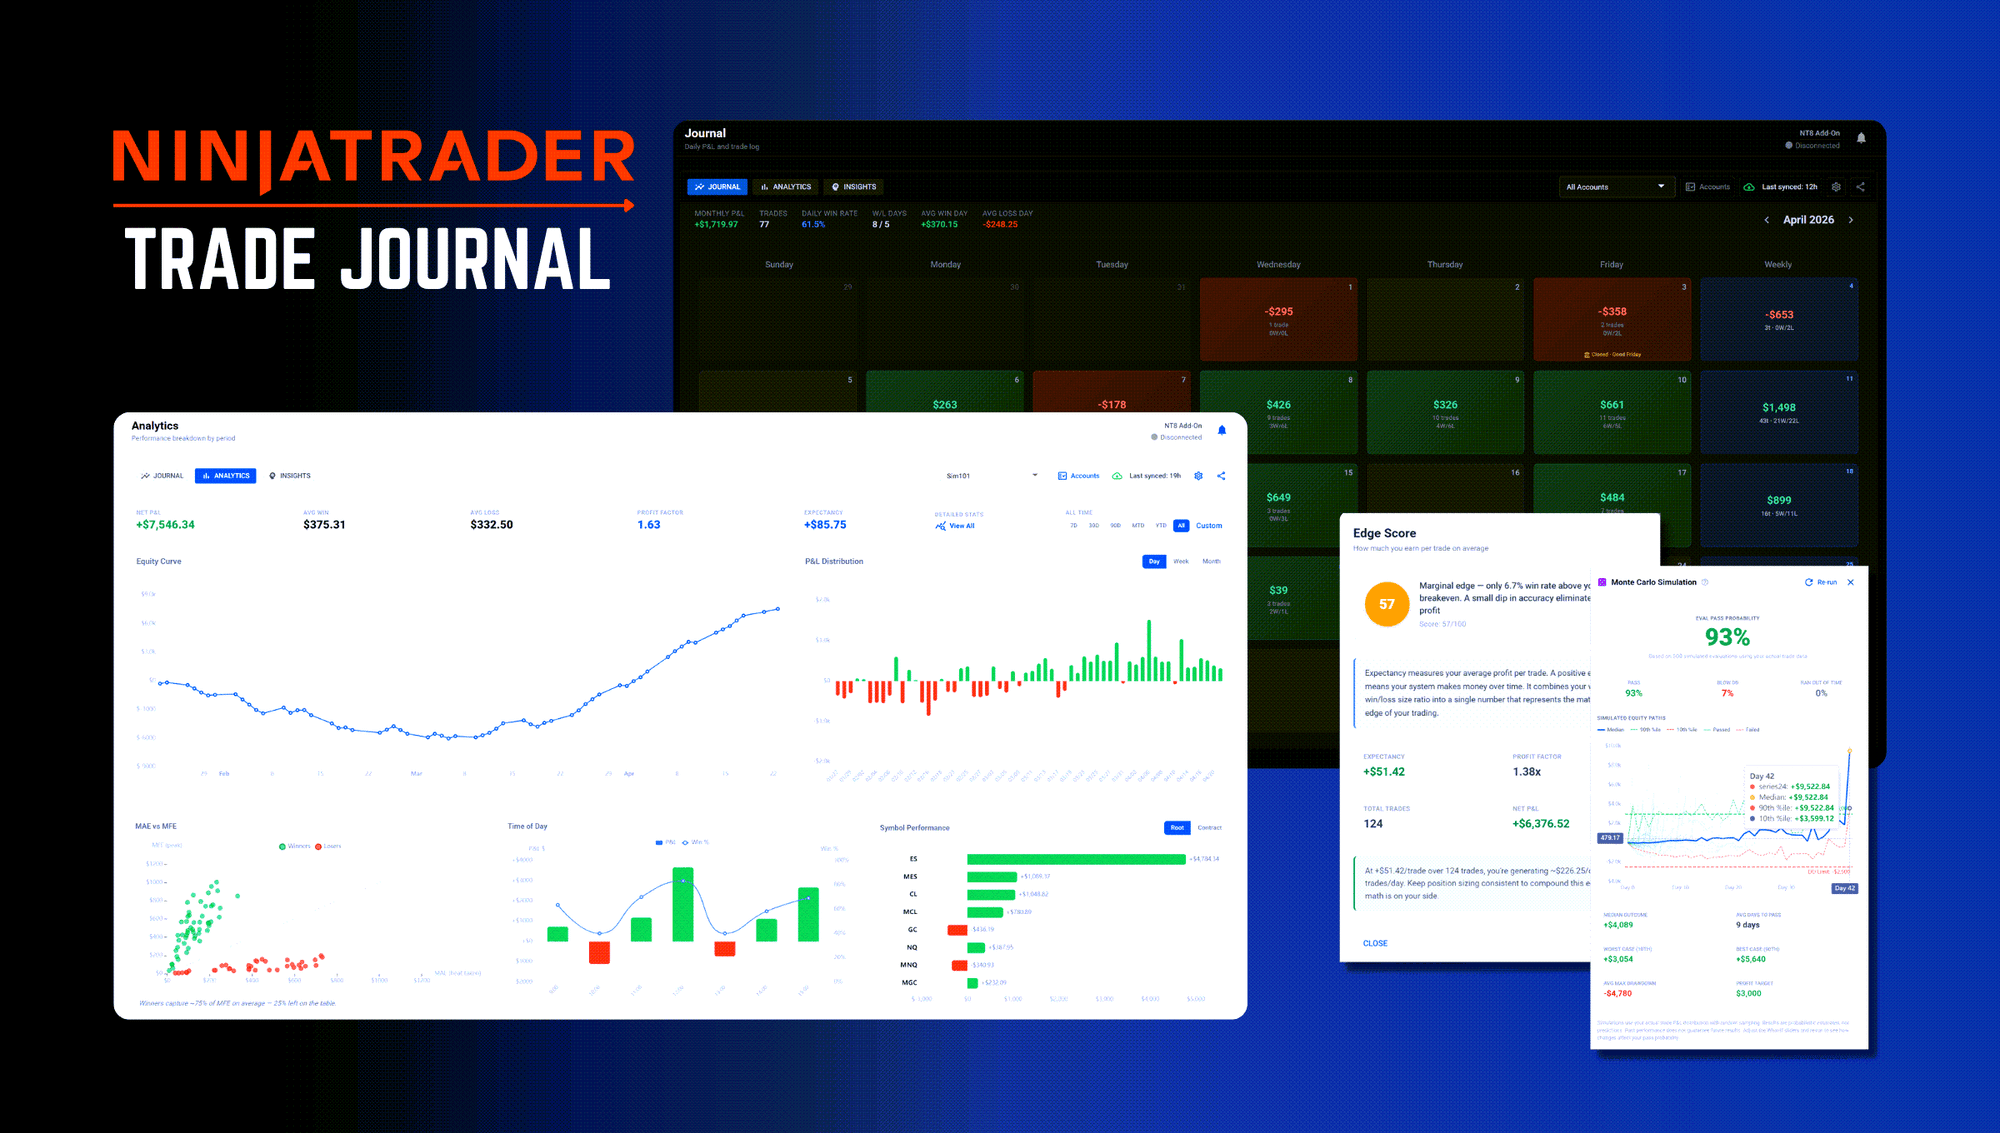
Most trading journals ask you to do the work twice. You trade in NinjaTrader, then you open some other app, find your trades, copy the data in, and build charts you could have just looked at in NT8. Then you close the app and go back to trading. The journal collects dust.
The CrossTrade Trading Journal imports execution history retained by NinjaTrader through the XT Add-On, and captures linked Tradovate fills server-side. Automatic broker capture requires an active subscription or trial. Existing journal records and review tools remain available on Free; Tradovate Fills CSV import provides a recovery path for missing sessions.
Here's what it actually does.
See the NinjaTrader and Tradovate trading journal for current access and features, and Importing Trades for the exact capture and recovery steps. Reconcile one completed session before interpreting the statistics.
The Calendar: Your Trading Month at a Glance
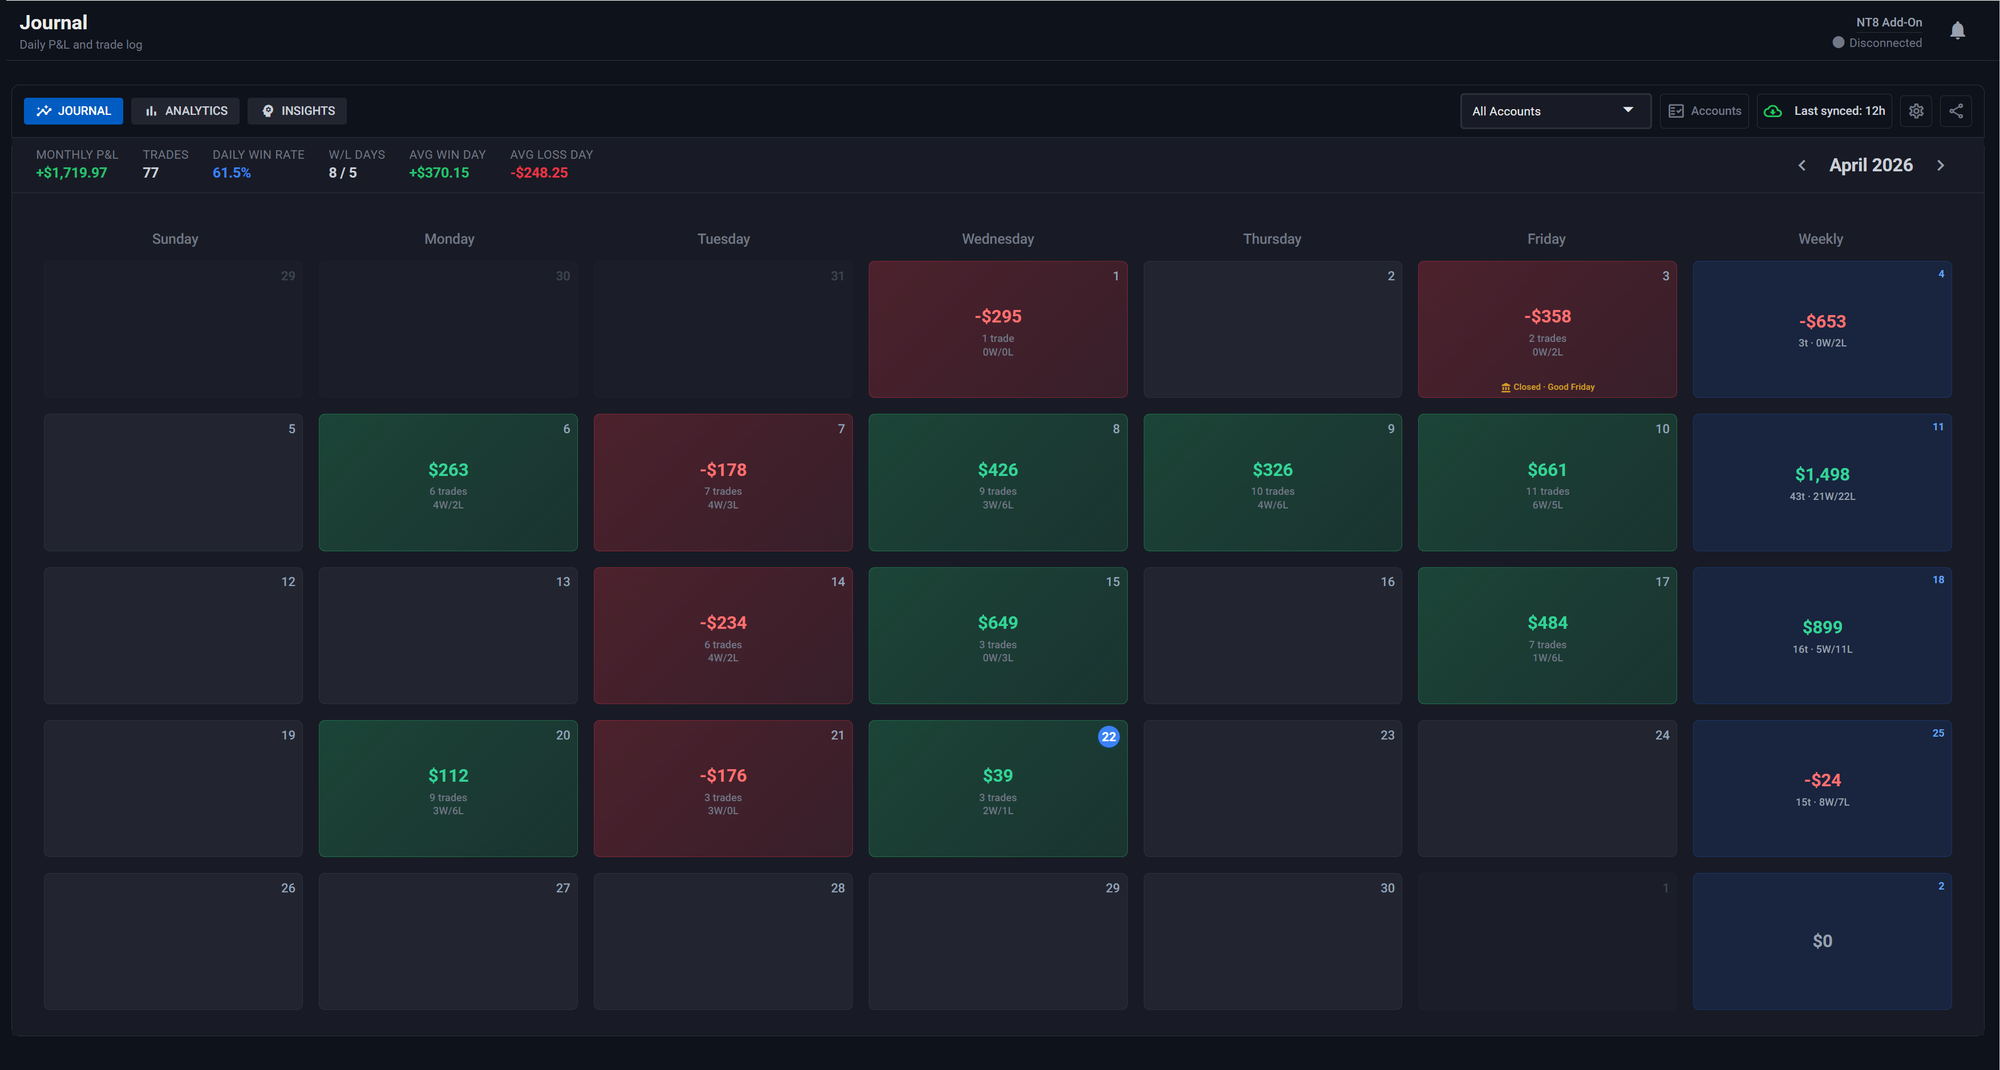
The journal opens on a calendar view. Each day shows your P&L, trade count, and W/L breakdown at a glance. Green tiles, red tiles, weekly summary columns — you can read a month's worth of trading in about three seconds without clicking anything.
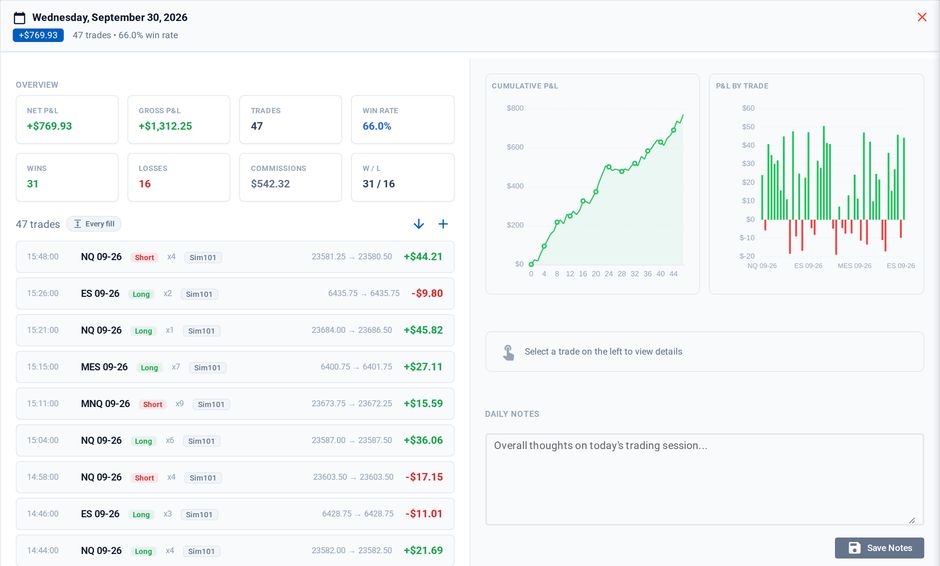
Click a day and you get a two-column modal: trade list on the left, analysis and charts on the right. The right side includes a cumulative equity curve for that day, a per-trade P&L bar chart, and a strategy breakdown by entry signal. Click into any trade and you get its full detail: Maximum Adverse Excursion, Maximum Favorable Excursion, entry efficiency, exit efficiency, and total efficiency. You can see exactly how much heat you took on every position and how much of the available move you captured.
The calendar also marks CME Globex holidays, both full closes and early closes, so you're not left wondering why November 27th looks weird.
For traders running multiple accounts, the account visibility manager lets you filter the calendar to any individual account or view them combined. Your prop eval accounts, your personal account, your sim accounts. Each one is a separate filter.
Review the trades your accounts actually took
Journal NinjaTrader and Tradovate fills with account filters and performance analytics. Free journal access and subscription-based automatic capture have different requirements.
Analytics: Your Numbers, Every Way You Need Them
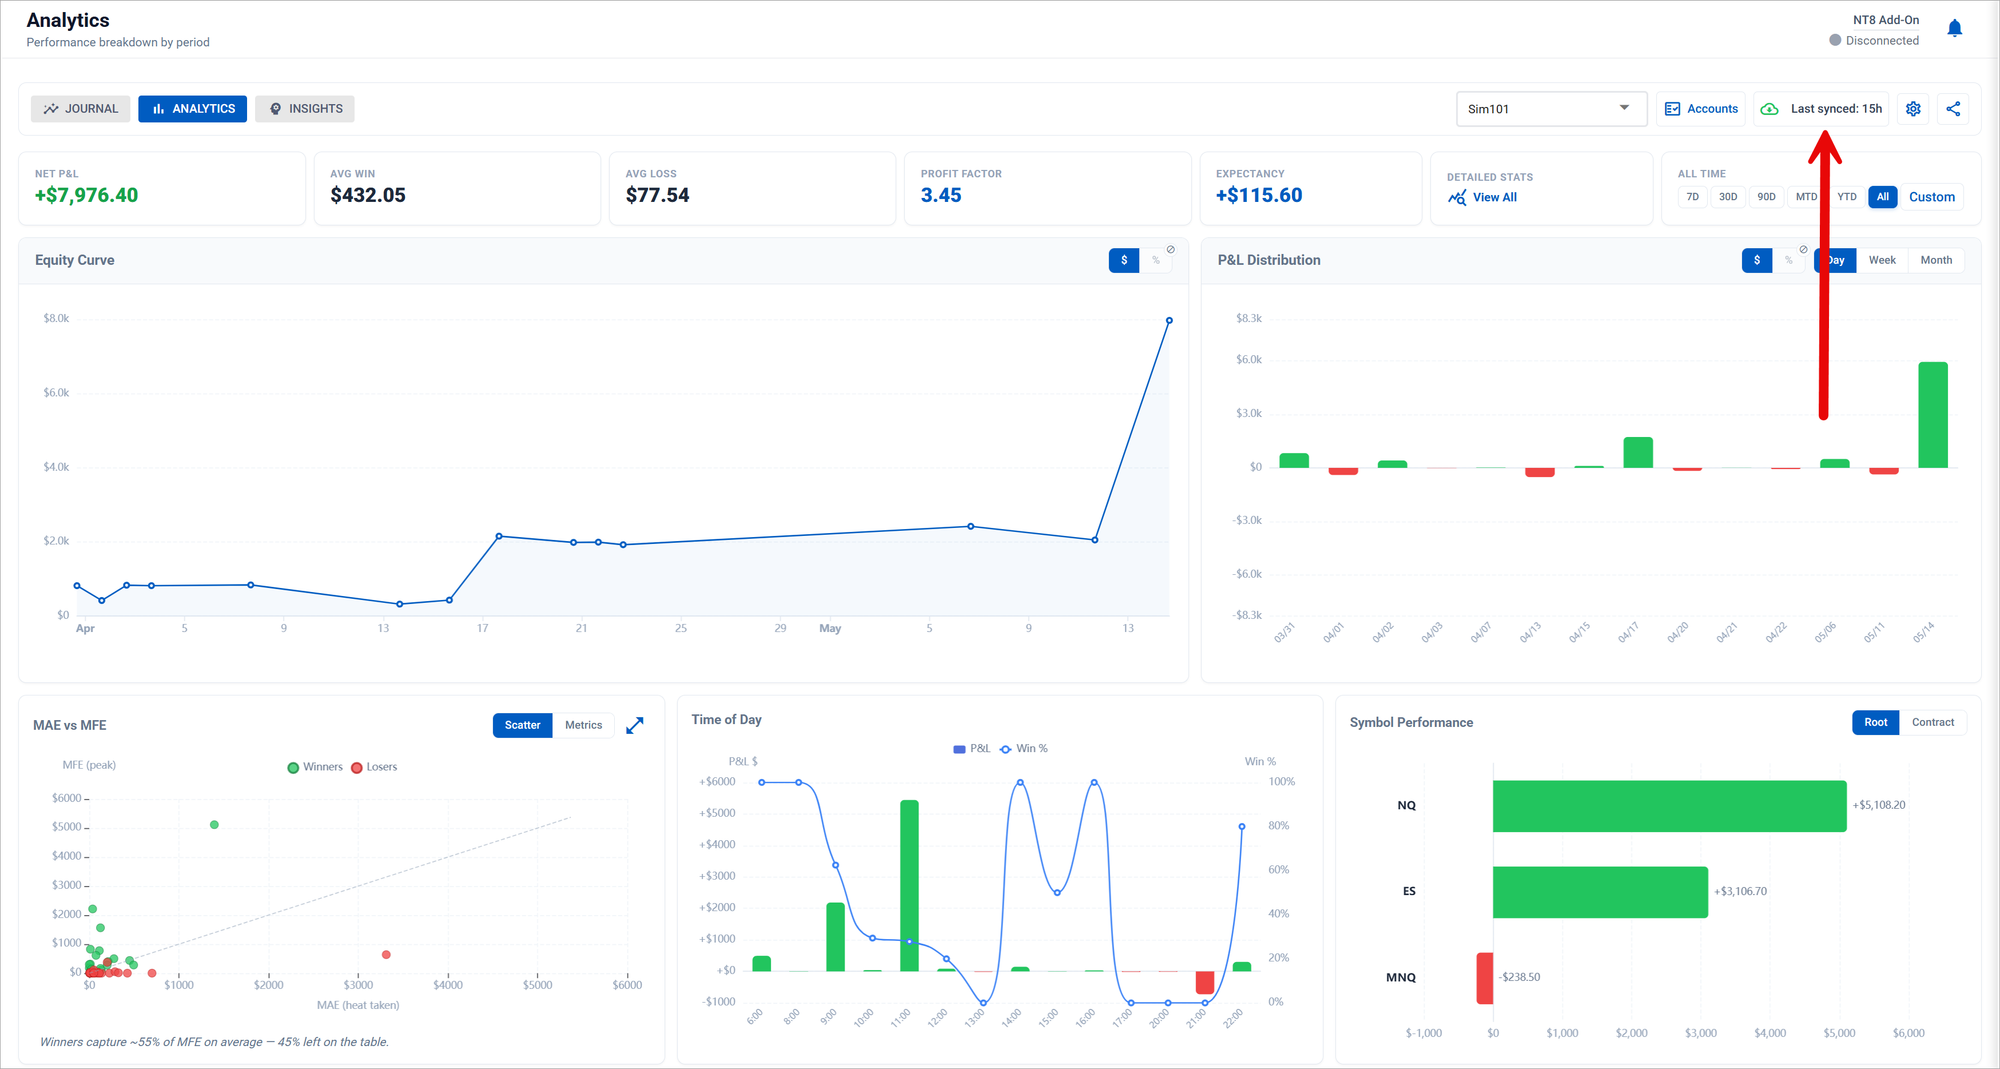
The Analytics tab is where the equity curve lives. Date range filters — 7D, 30D, 90D, MTD, YTD, All, or a custom range — apply across every chart simultaneously. You're never looking at metrics that span different time windows.
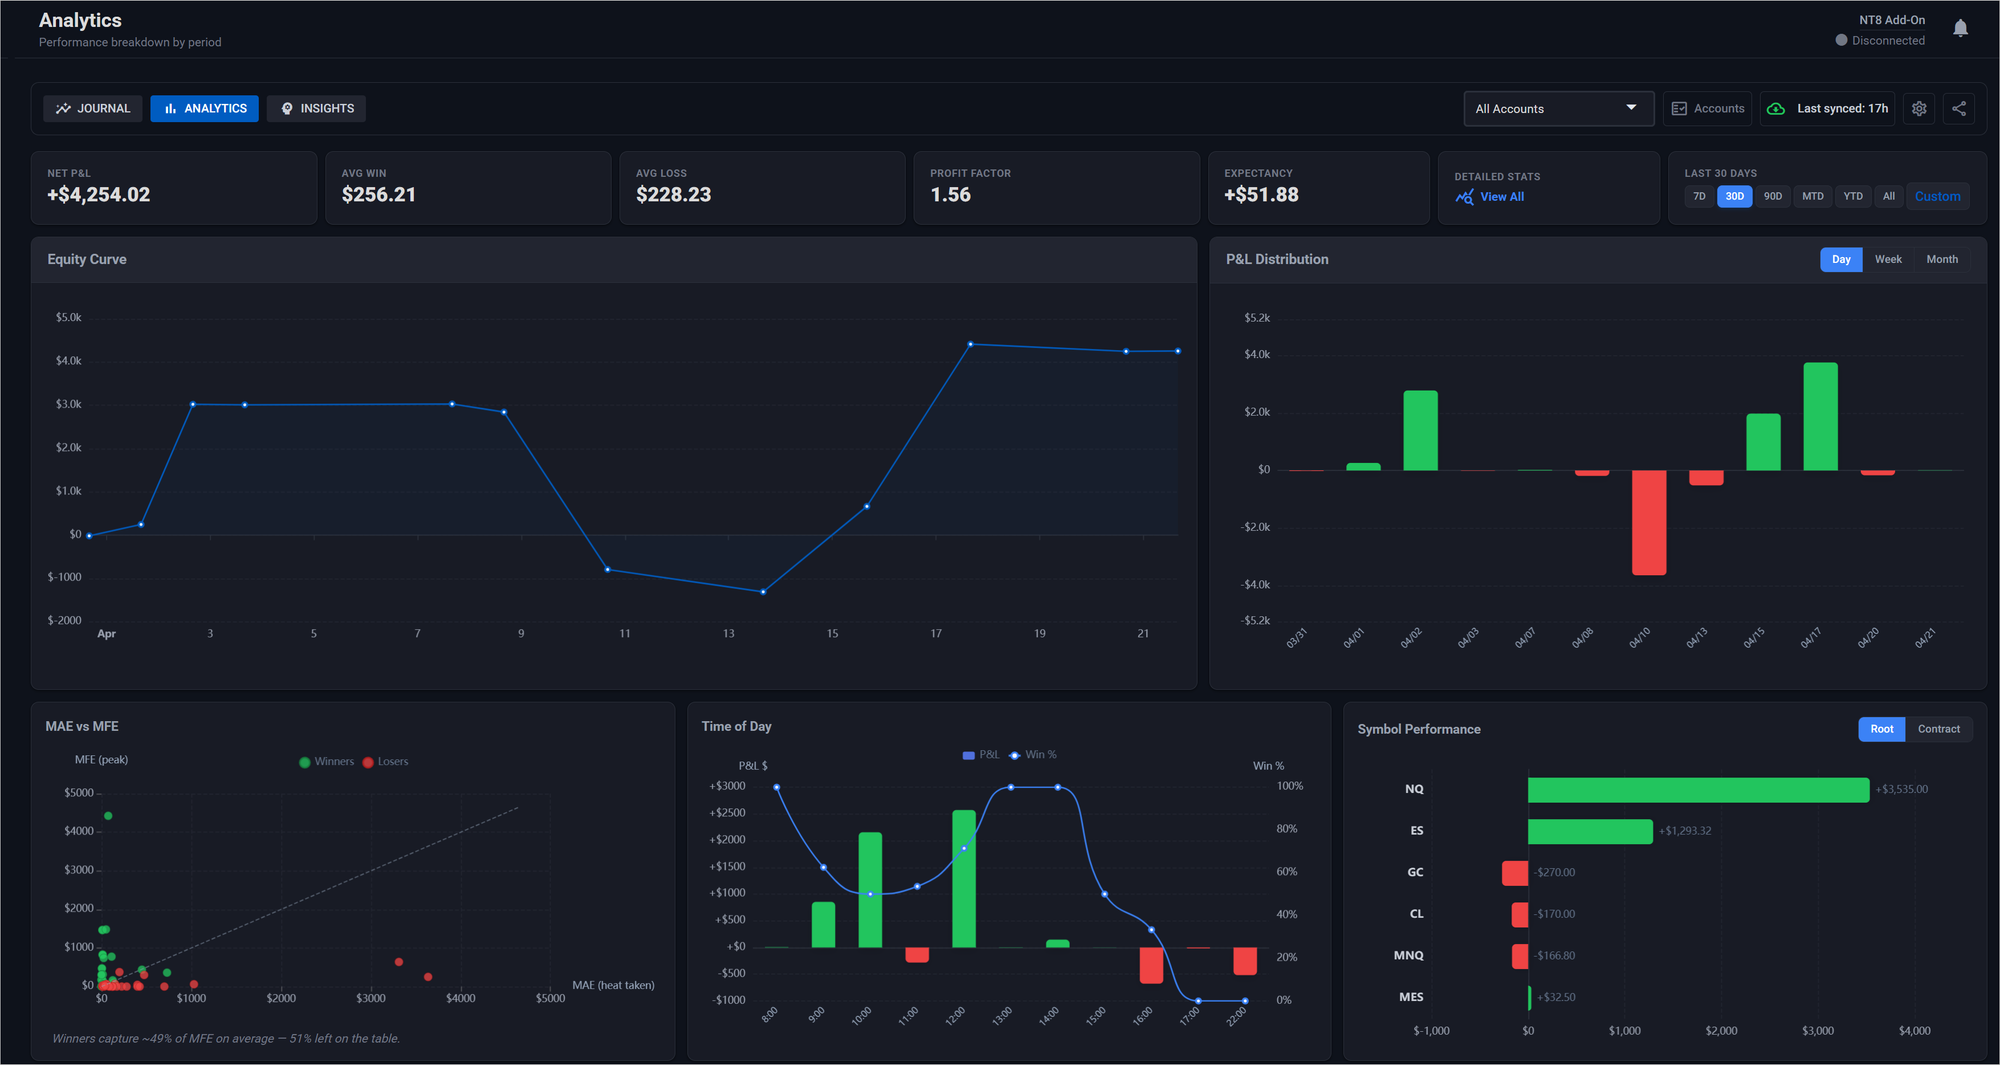
The equity curve is the main event, but the analytics page goes further. The P&L distribution chart shows your day-by-day, week-by-week, or month-by-month results as a bar chart. The time-of-day breakdown shows where your edge is strongest and weakest across the trading session. Symbol performance breaks down P&L, trade count, and win rate by instrument, with a toggle between root symbols (ES, NQ, CL) and specific contract months.
The detailed stats drawer contains the numbers that matter for evaluating a real edge: Sharpe ratio, Sortino ratio, R², Recovery Factor, profit factor, average hold time, commission drag, max drawdown, largest win day, and largest loss day. Every metric has an educational modal — click it and you get a plain-English explanation of what the number means, what a good value looks like, and what to do about it if yours isn't.
Coaching Insights: Not Statistics, Prescriptions
The Insights tab is the one that actually changes how you trade. Its stated philosophy, straight from the code: "Am I going to pass, and what do I need to do differently?" It's not a stats page. It's an eval survival tool.
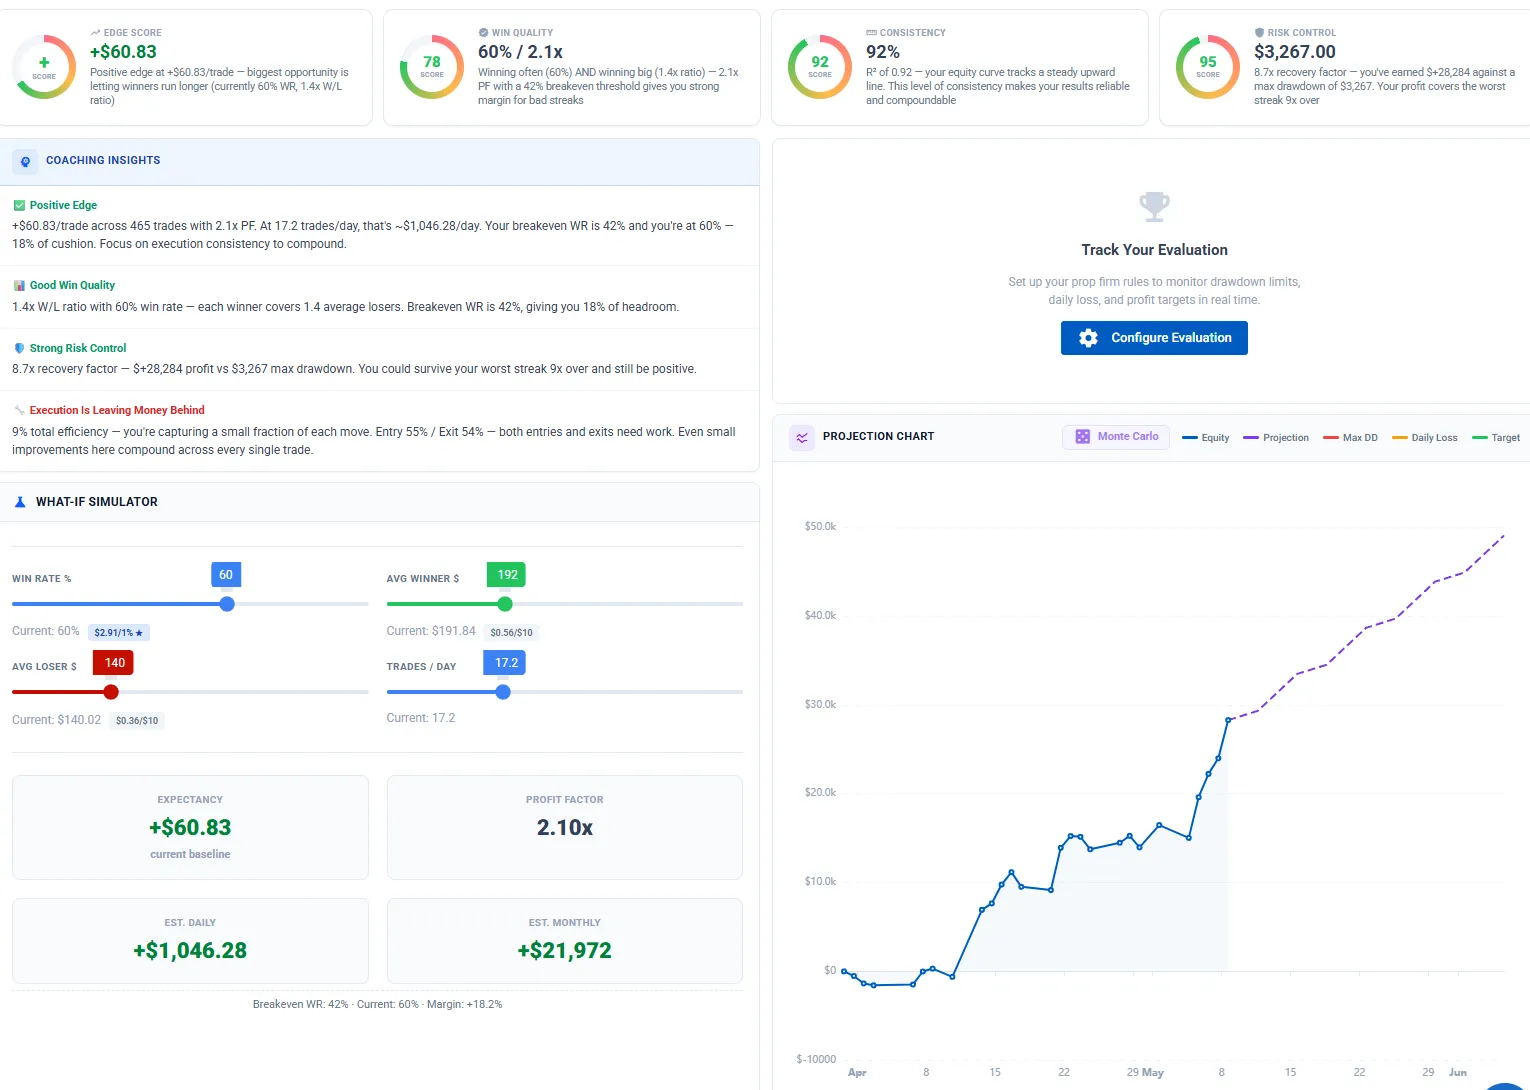
Four gauge cards score your trading across the dimensions that matter. Edge Score measures your expectancy — your average profit per trade — relative to your win/loss size ratio. Win Quality looks at whether your profit factor is sustainable given your win rate, and tells you exactly how far above or below your breakeven win rate you're operating. Consistency uses R² to measure how smooth and compoundable your equity curve is. Risk Control calculates your recovery factor: how many times over your total profit covers your maximum drawdown. Each gauge is a 0–100 score with color coding and a plain-English explanation of your specific numbers.

The coaching suggestions below the gauges don't say "improve your win rate." They say things like: your average loss ($187) wipes out 1.3 winners at your current avg win of $143 — cap losses at $141 and your expectancy flips from +$47 to +$79 per trade. Every suggestion is denominated in dollars, and every suggestion is linked to the What-If simulator.
The What-If Simulator has four sliders: win rate, average winner, average loser, and trades per day. Move any slider and watch expectancy, profit factor, and projected daily P&L update live. Click a coaching suggestion and the sliders snap to those exact values so you can preview the impact before you change anything. The projection chart below updates simultaneously — your actual equity curve extends into a projected line based on what the What-If parameters would produce going forward.
Prop Eval Tracker: Know Exactly Where You Stand
The prop eval tracker lets you start with a firm preset or configure custom parameters. Check the actual agreement for your program and account stage before using a preset; firms change rules, and the journal is not the firm's official risk ledger.
Once configured, the tracker displays live progress bars for profit target, max drawdown, and daily loss limit. Each bar shows your current position, the limit, and the buffer remaining. If you're within 85% of a drawdown or daily loss limit, the bar turns red and flags DANGER. The drawdown type — trailing, end-of-day, or static — is applied correctly based on the firm's actual rules. For firms with a consistency rule (Apex's 50% rule, MyFundedFutures' 40% rule), the tracker monitors whether any single trading day represents too large a share of your total profit and shows PASS or FAIL in real time.
The tracker also calculates your projected account balance based on your starting balance plus net P&L, so you always know where the account stands relative to the target.
Monte Carlo Simulation: Estimate Outcomes from Your Sample
The Monte Carlo simulation runs 500 independent evaluations using your real trade P&L distribution. Each simulation samples from your actual trade history, runs forward day by day, and checks whether the simulation hits the profit target or blows the drawdown limit before the time window closes.
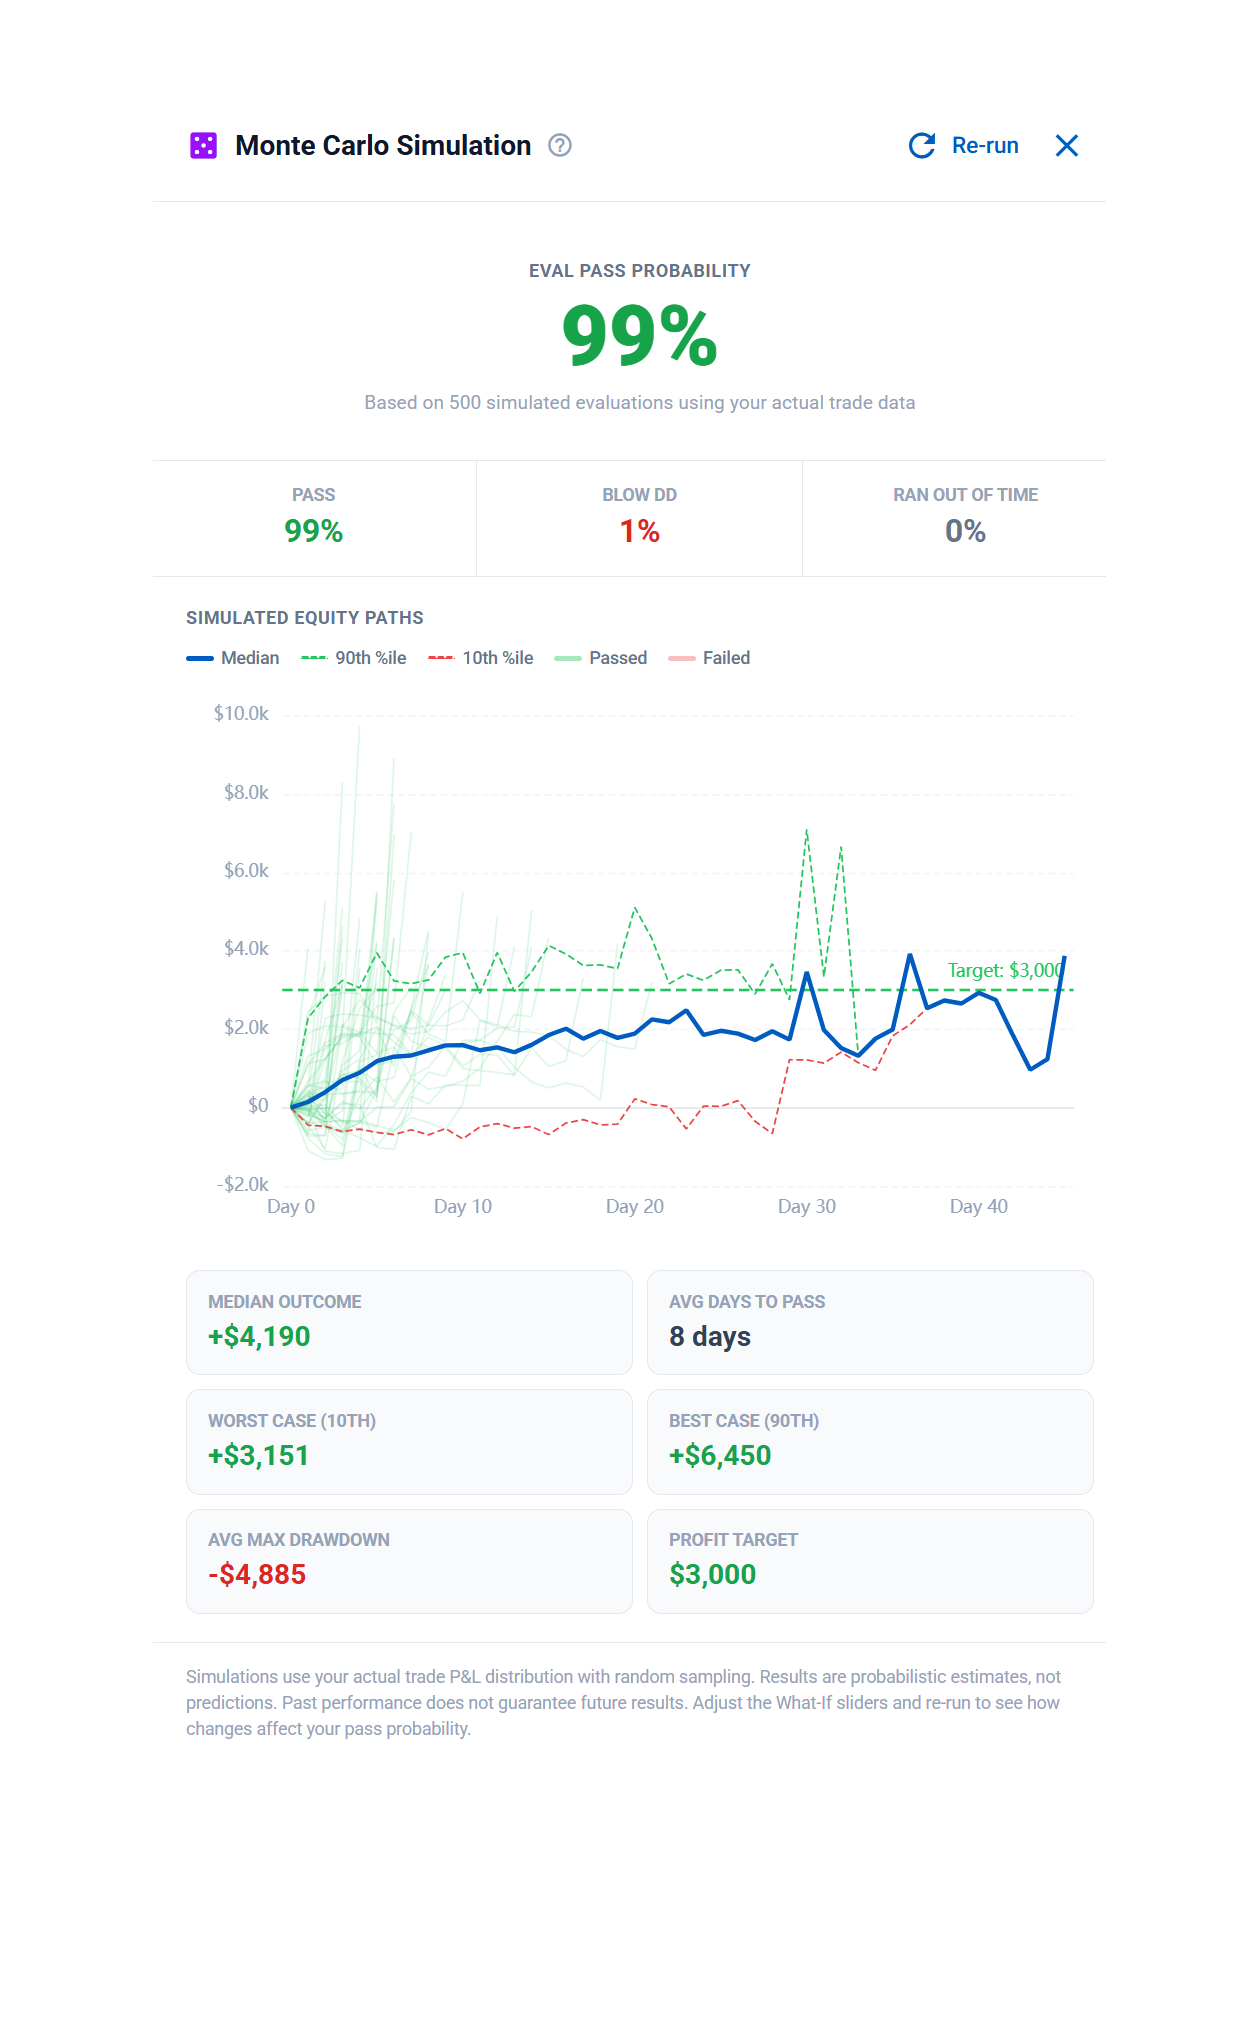
The output summarizes the scenarios generated from your sample and configured rules: simulated pass/fail rates, drawdown and an equity range. Those are model estimates, not a verified probability of passing a future evaluation. A small or unrepresentative trade sample limits what they can tell you.
The simulation integrates directly with the What-If simulator. Adjust the sliders — cap your average loss, improve your win rate, change your trade frequency — and re-run the Monte Carlo. The pass rate updates to reflect your modified parameters. It's the difference between guessing whether a change will help and actually seeing the math.
How Import and Auto-Sync Work
For NinjaTrader, the Add-On reads execution history still available in the platform and sends it to CrossTrade for trade matching. Tradovate's standard fill API is session-based, so daily capture matters: a missed session is not automatically unlimited broker history. Recover an available missing day with a Tradovate Fills CSV in Journal Settings.
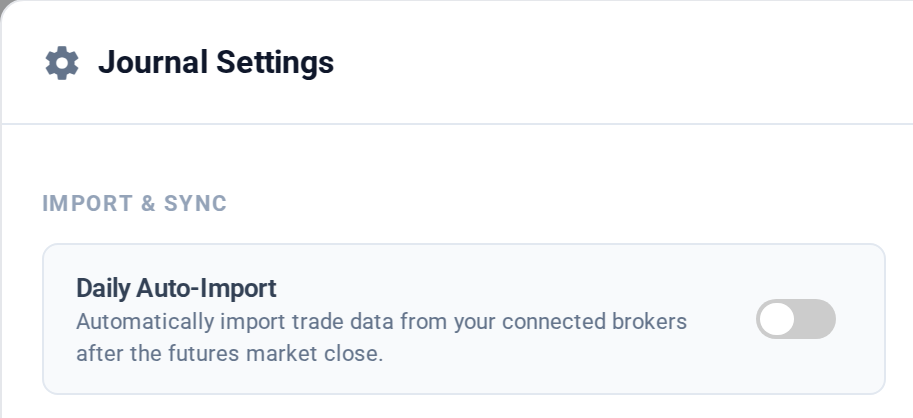
Daily Auto-Import in Journal Settings
With an active subscription or trial and a working connection, daily automatic import keeps eligible broker history current. Check Journal Settings and reconcile the account, instrument, quantity, commissions and timezone against the source records. Automatic capture stops when the subscription or trial ends.
Multi-account setups work exactly as expected. If you're running five prop accounts and a personal account, they all import. The account visibility manager controls which ones appear in each view.
Who This Is For
The journal is useful for anyone trading NinjaTrader 8, but it was built with prop traders specifically in mind. The eval tracker, Monte Carlo simulation, the consistency rule monitoring, the coaching suggestions denominated in eval-relevant dollar amounts — those features exist because passing an evaluation is a specific problem with specific constraints. The journal treats it that way.
For discretionary traders, the strategy tagging and time-of-day analysis are where the value lives. You finally get a clear answer to "which setups are actually working" and "when am I at my worst."
For automated traders running CrossTrade webhooks, the journal gives you the performance layer that tells you whether the strategy you're automating has a real edge and where it's leaking.
Journal access remains available on the Free plan after a trial or subscription ends. Your existing records stay accessible, and Tradovate CSV import is available. Automatic broker capture is a separate subscription/trial feature; see current plans.
Start your free 7-day trial — full access, no credit card required.