Enhancing Analysis with New Indicators in the Stock Screener
TradingView added new indicators to the Screener for enhanced analysis.
June 26
The TradingView Stock Screener now includes advanced indicators designed to improve analysis and stock selection. These new features encompass various performance ratios, metrics for capital and debt management, a new growth indicator, and an additional security identifier. Let's explore each group of indicators and their potential impact on your analysis:
Margins and Ratios
The latest additions provide metrics to evaluate the efficiency of resource utilization, specifically in generating profits from assets and equity:
- Return on Tangible Equity (ROTE) %: Measures the effectiveness of a company's use of its equity capital to generate profits.
- Return on Tangible Assets %: Assesses how efficiently a company generates revenue from its tangible assets.
- Return on Total Capital %: Calculates the profit generated through a company's capital structure.
Indicators that evaluate asset and inventory utilization and turnover include:
- Assets Turnover: This ratio compares a company's sales or income to its asset value, indicating asset usage efficiency. Higher ratios suggest greater efficiency.
- Inventory Turnover: Shows how often a company turns over its inventory relative to its cost of goods sold (COGS), reflecting inventory usage efficiency.
Debt obligations and interest payment coverage indicators are:
- Debt to Assets Ratio: Indicates the proportion of debt relative to assets. A high ratio signals higher insolvency risk.
- Total Debt to Capital: Reveals financial leverage by dividing liabilities by total capital.
- Net Debt to EBITDA: Shows how many years it would take to pay off debt if net debt and EBITDA remain constant. A negative ratio means the company has more cash than debt.
- Interest Coverage: Assesses a company’s ability to make interest payments with its earnings. Higher ratios indicate better capability to repay interest-bearing liabilities.
- EBITDA Interest Coverage: Evaluates the ease of paying interest on debt by dividing EBITDA by interest expense.
- EBITDA Less Capex Interest Coverage: Measures the ability to pay interest expenses based on EBITDA minus capital expenditures.
For shareholder equity management and returns, the indicators include:
- Assets to Equity Ratio: Shows the ratio of total assets to equity capital owned by shareholders.
- Buyback Yield %: Represents the cash spent on repurchasing common stock over a specified period, divided by market capitalization at the repurchase period’s start. This allows comparison of share repurchase impact across companies.
- Cash Dividend Coverage Ratio: Calculates how many times dividends can be paid to shareholders using net income.
Security Information
- Target Price: The forecasted price analysts expect the stock to reach in the future.
- Target Price Performance %: The percentage difference between the forecasted price and the current price.
- ISIN (International Securities Identification Number): A unique twelve-digit code for securities issues worldwide. Available only as a column.
Growth Indicators
- Capital Expenditures Growth % (Capex Growth): Shows the change in a company's spending on long-term assets, essential for understanding investments in future growth and profitability.
How to Use the New Indicators in the Screener
You can add these new metrics as either filters or columns:
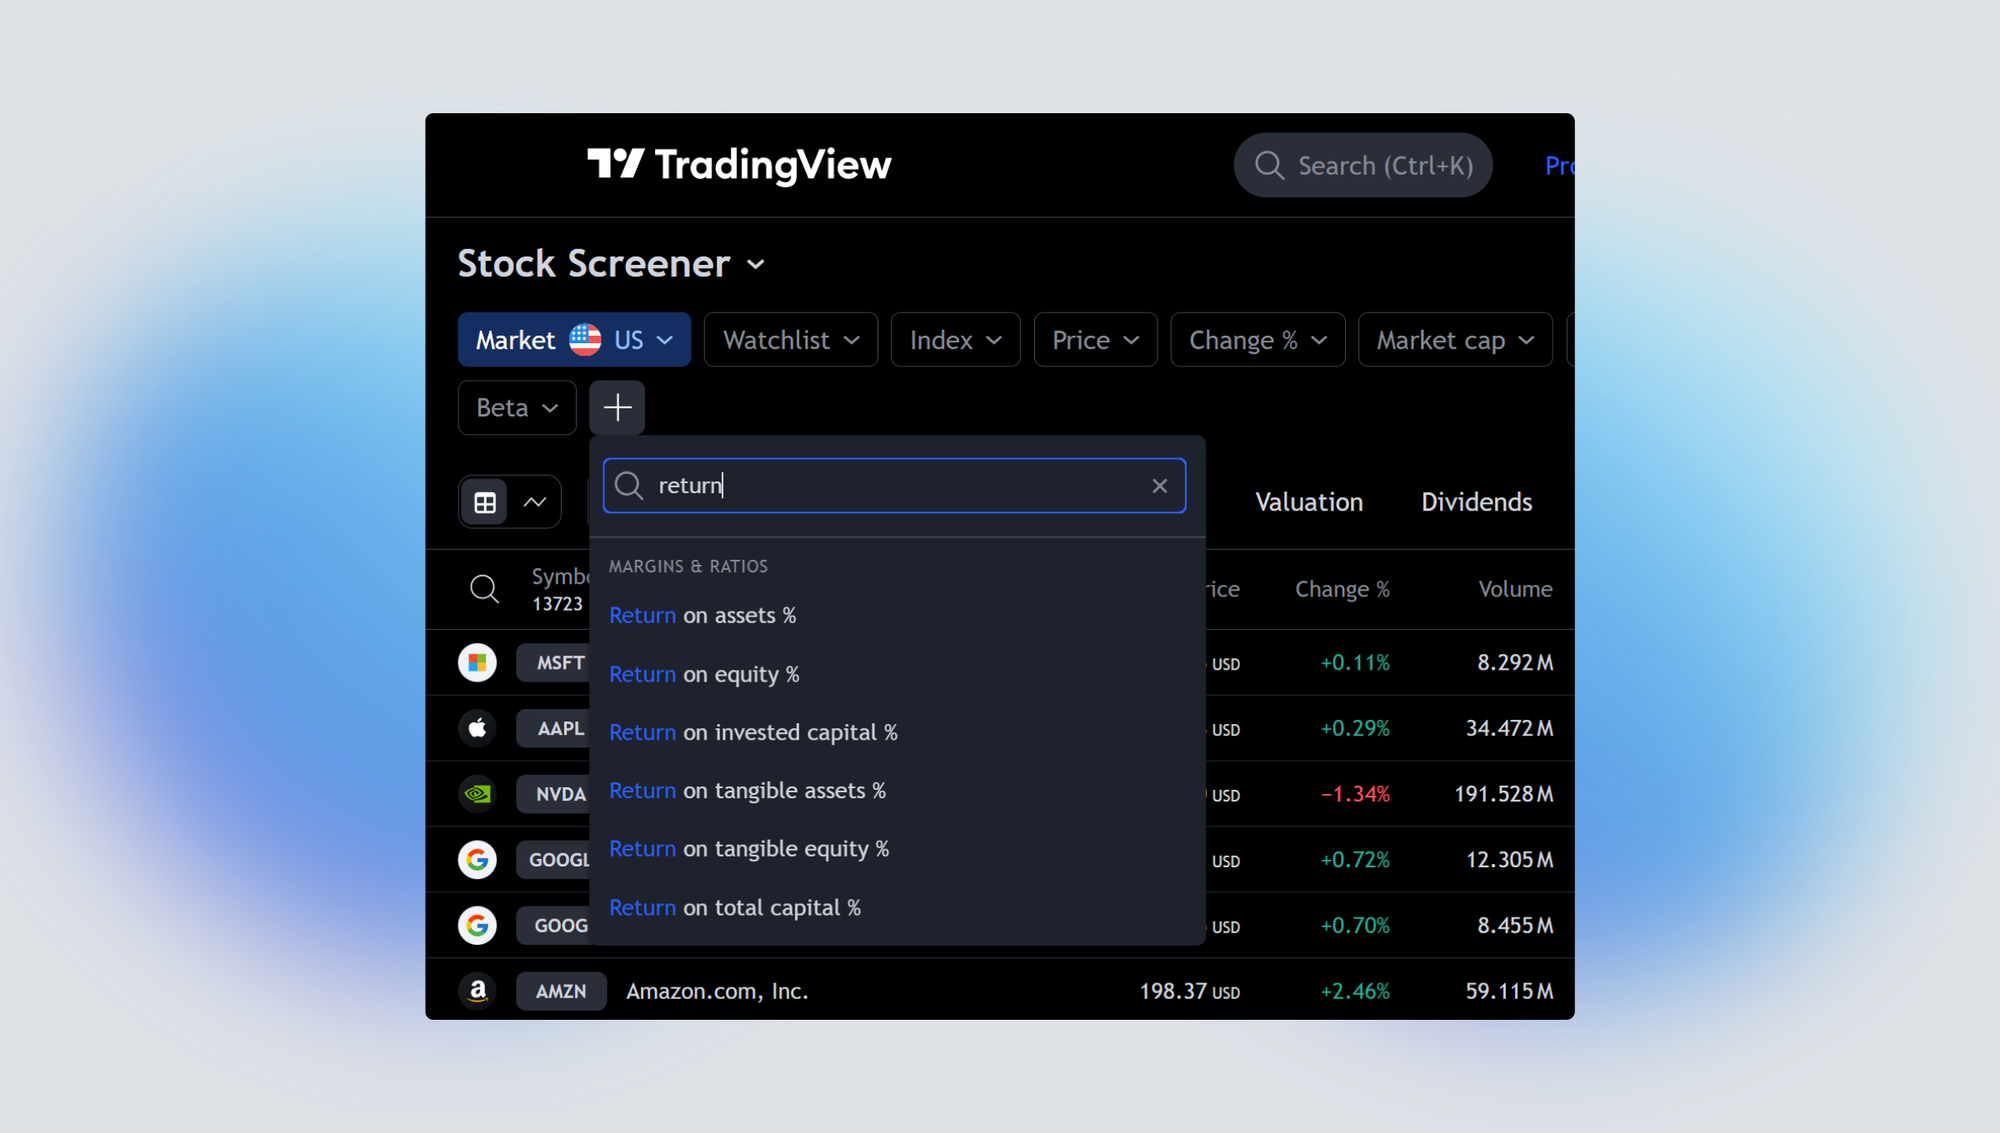
Using Filters: To add a filter, click the + button in the top panel and select your desired indicator. You can apply popular filter sets automatically by clicking on them. For custom setups, choose "Manual setup" from the filter drop-down list and input your specific conditions.
Using Columns: Add columns with the desired indicators to the table and sort the list as needed.
These new indicators aim to provide more precise and reliable data to support your stock analysis. We encourage you to explore these features and integrate them into your strategies for better insights and decision-making.