Indicator Spotlight: VWAP Trend Indicator
The VWAP with Trend Alerts Indicator combines the power of the VWAP with customizable trend signals and dynamic support and resistance levels. This tool helps traders identify prevailing trends, assess volatility
In this installment of our Indicator Spotlight series, we’re diving into the VWAP with Trend Alerts Indicator, a robust tool that combines the Volume Weighted Average Price (VWAP) with customizable visual cues and trend-based signal alerts. Whether you're assessing trend strength or looking for precise entry and exit points, this indicator has you covered.
Understanding the VWAP with Trend Alerts Indicator
The VWAP (Volume Weighted Average Price) is a staple in many traders' toolkits, acting as a key reference point for assessing market trends and price movement. The VWAP with Trend Alerts Indicator takes this widely used tool a step further by adding features like standard deviation bands, trend-based bar coloring, and custom alerts, giving traders a full suite of capabilities to improve their strategy.
Key Components:
- VWAP Calculation: The core of this indicator, VWAP calculates the average price of an asset based on both its price and volume. It helps traders gauge the true average price of an asset over a period of time, making it easier to identify the overall market trend and potential entry or exit points.
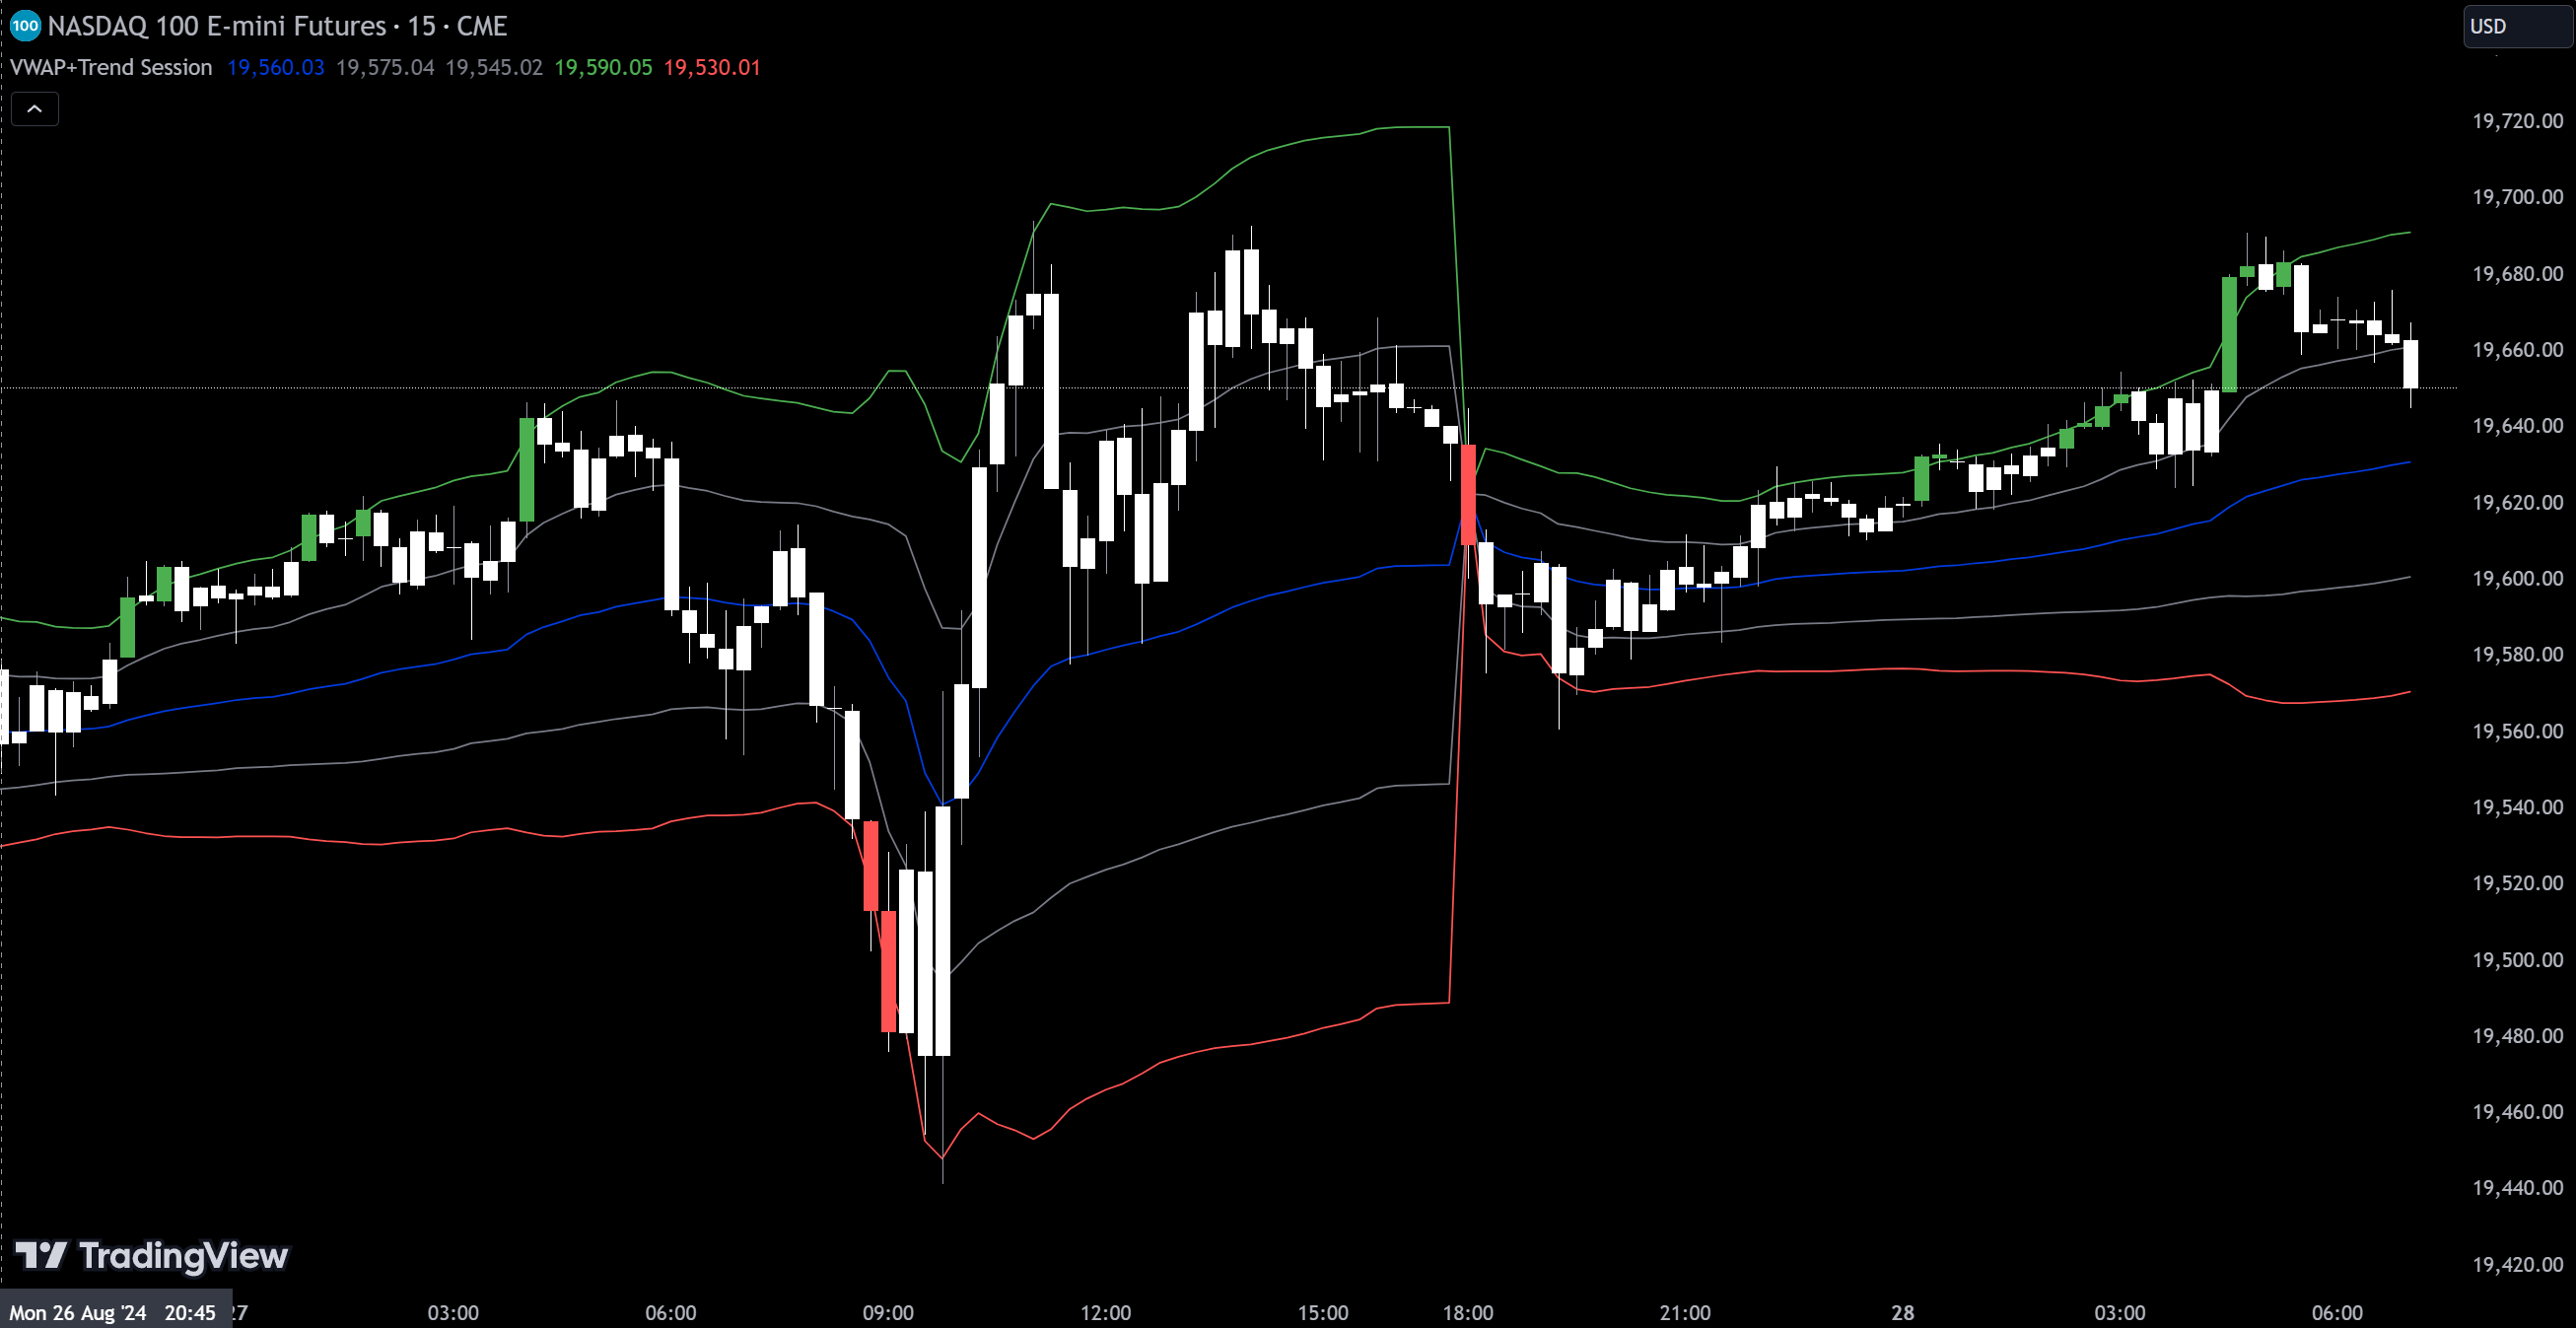
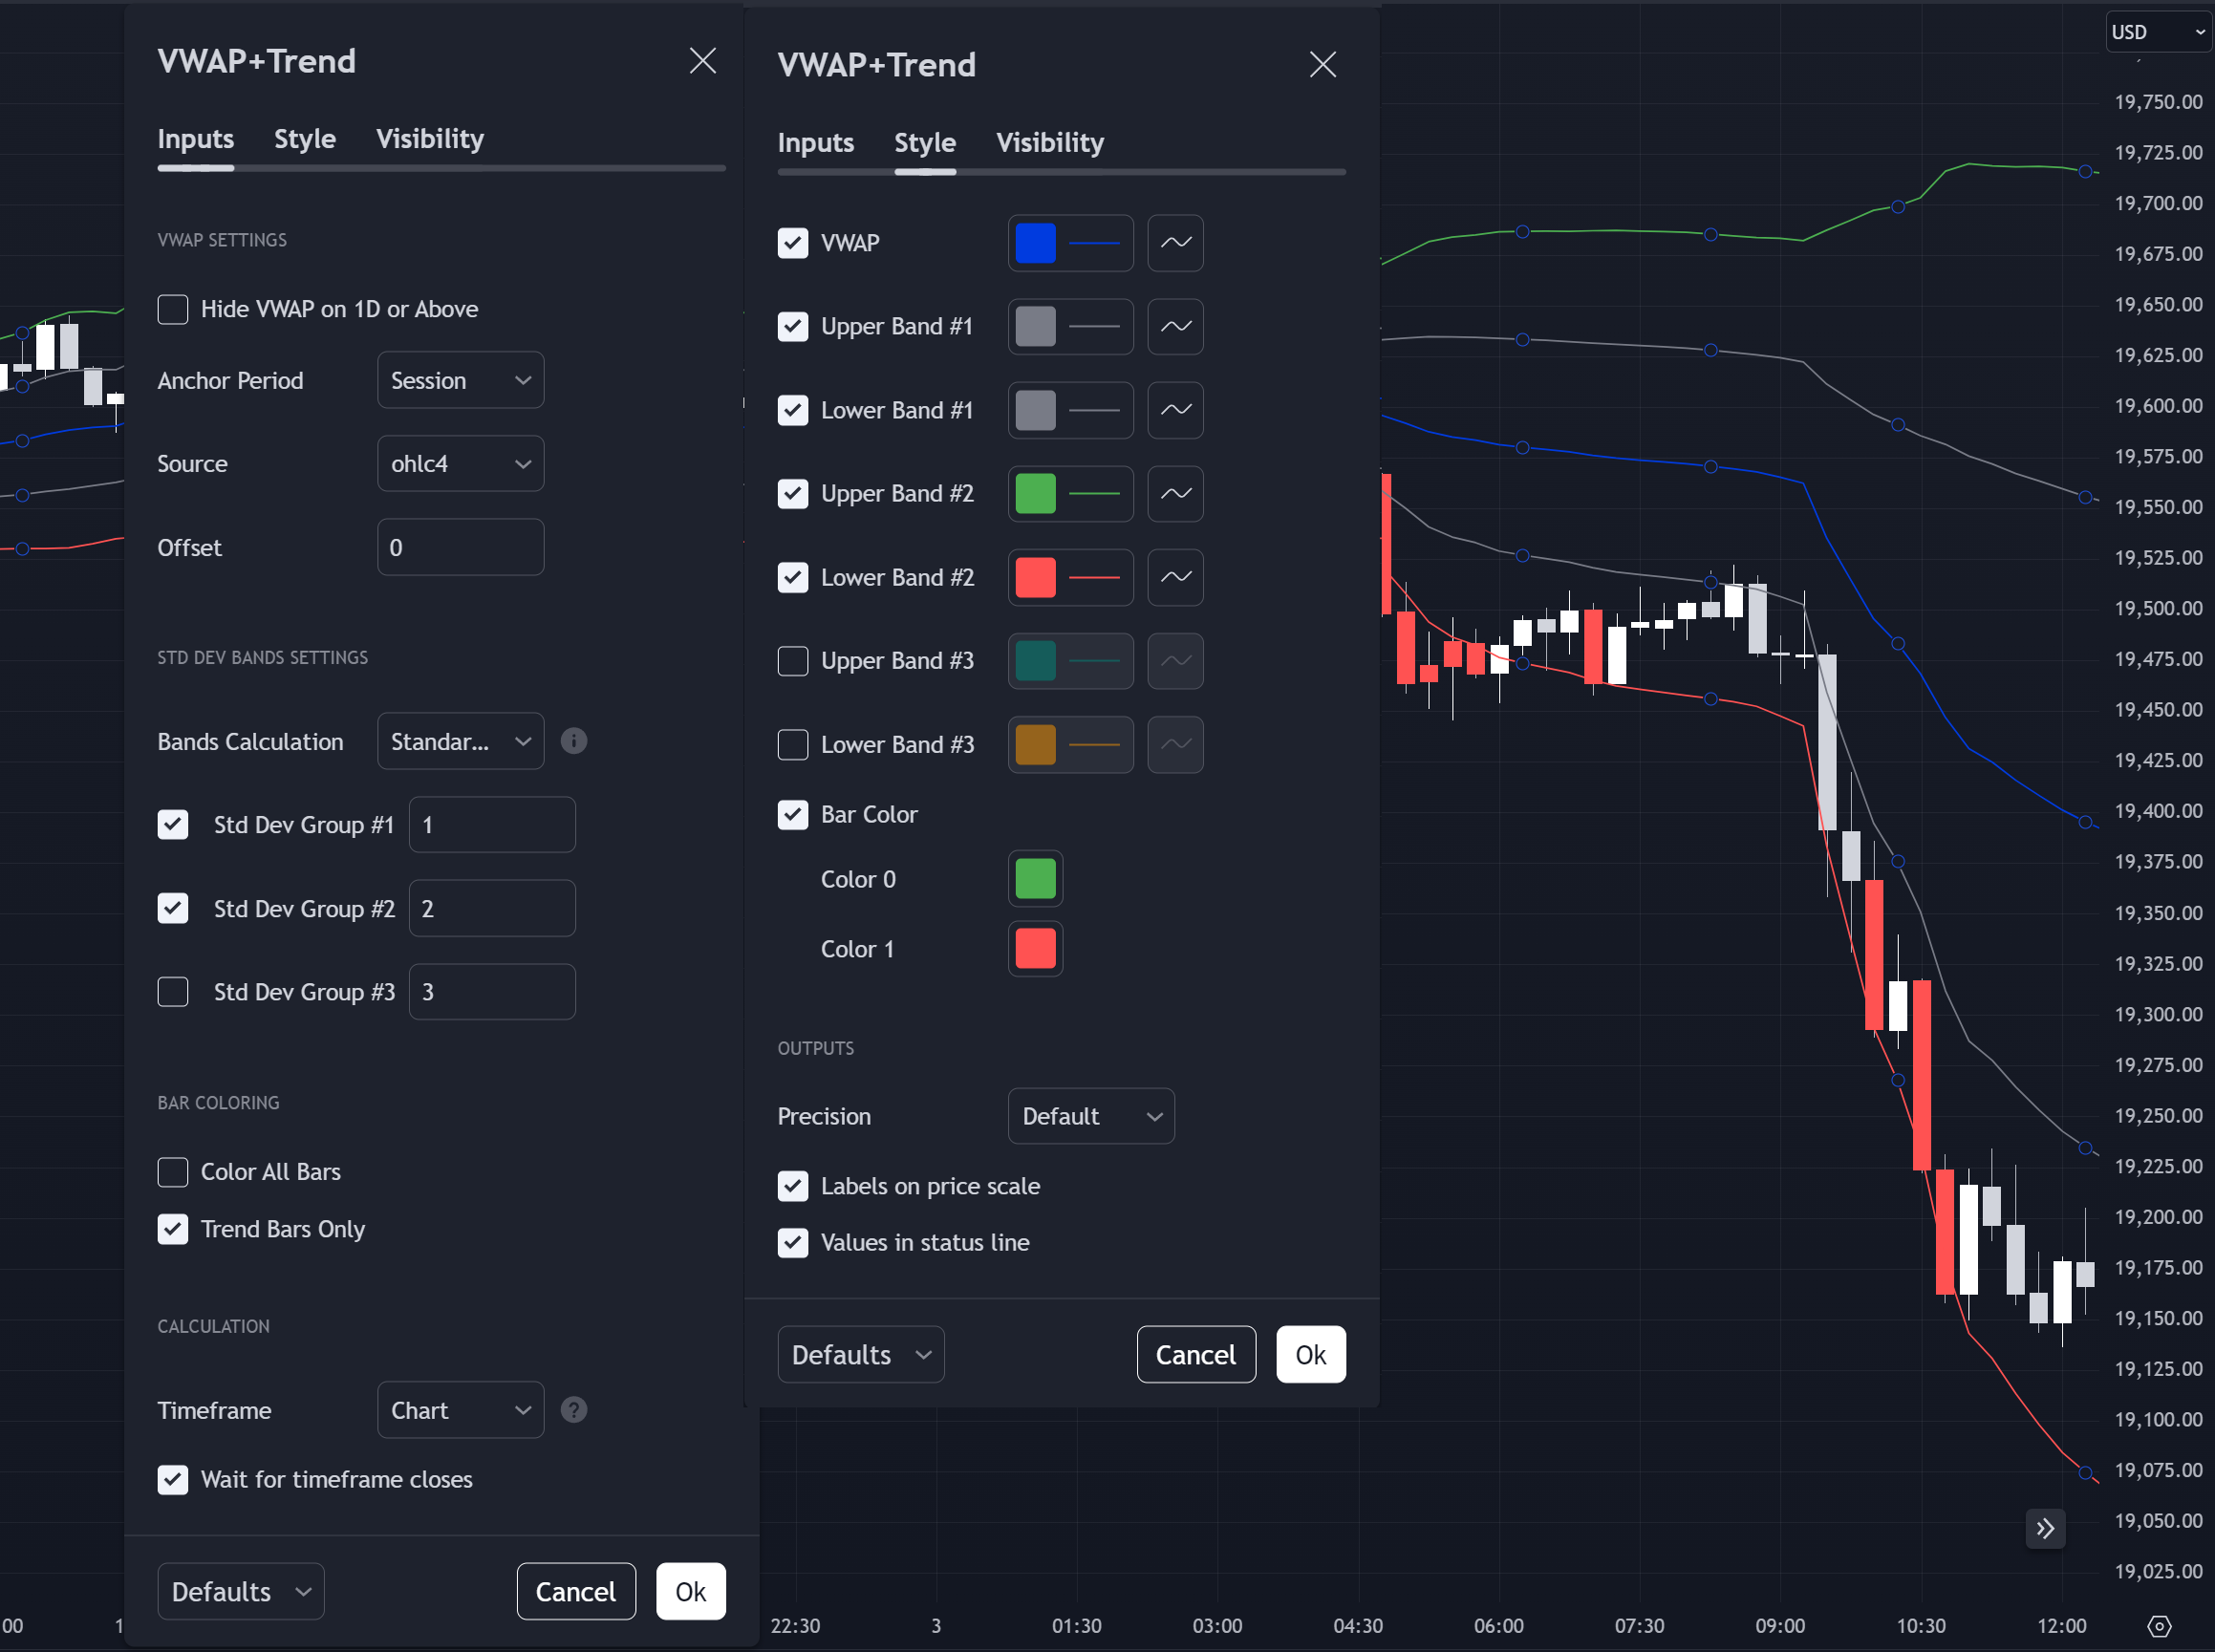
- Standard Deviation Bands: Surrounding the VWAP line are up to three customizable standard deviation bands, providing dynamic support and resistance levels. These bands help traders understand price volatility and can signal potential breakouts or reversals.
- Trend Bar Coloring: The indicator offers options to color bars based on where they close relative to the VWAP and its bands, visually highlighting significant trends or market shifts.
- Buy and Sell Signals: Using trend-based criteria, the indicator generates buy and sell signals, helping traders spot key opportunities for entering or exiting the market.
- Custom Alerts: The script allows you to set alerts for specific buy or sell conditions, ensuring you don’t miss important signals.
Key Features Explained
VWAP & Trend Analysis
The VWAP is widely regarded for its ability to reflect an asset's "true" price during a session by factoring in both price and volume. Prices closing above the VWAP generally indicate strength and an uptrend, while prices below the VWAP often suggest weakness or a downtrend.
In addition to the basic VWAP calculation, this indicator surrounds the VWAP line with standard deviation bands. These bands are particularly useful for measuring market volatility:
- Narrow bands reflect lower volatility.
- Wider bands suggest higher volatility and potential breakout or reversal points.
Standard Deviation Bands
The VWAP with Trend Alerts Indicator allows for up to three customizable bands above and below the VWAP. Traders can adjust the standard deviation multipliers to suit their strategy, making it easy to tailor the indicator for different market conditions.
These bands serve as dynamic support and resistance levels, and when price breaks through or reverses at these bands, it often signals a significant market move.
Bar Coloring and Signal Alerts
Bar Coloring Options
Bar coloring is a standout feature that enhances visual analysis:
- Color All Bars: When this option is enabled, every bar on the chart is colored based on whether it closes above (green) or below (red) the VWAP. This makes it easy to spot the general trend direction at a glance.
- Trend Bars Only: For traders looking to zero in on major price movements, this option colors only the bars that close beyond the second standard deviation band. These trend bars highlight significant uptrends or downtrends, helping traders focus on the most impactful movements.
Buy and Sell Signal Conditions
To assist with trade decisions, the indicator includes built-in conditions for buy and sell signals:
- Buy Signal: Generated when a bar closes above both the VWAP and the upper second standard deviation band. This signal points to a strong uptrend, indicating a good entry point for long positions.
- Sell Signal: Triggered when a bar closes below both the VWAP and the lower second standard deviation band. This suggests a strong downtrend and potential entry for short trades.
Alert Conditions
To ensure you never miss a trading opportunity, the VWAP with Trend Alerts Indicator includes customizable alert conditions tied to the buy and sell signals. These alerts can be set to trigger automatically, notifying you when trend bars signal a strong market move.
How to Use the VWAP with Trend Alerts Indicator
Trend Identification
The VWAP and its standard deviation bands are excellent tools for identifying the market's prevailing trend. Bars consistently closing above the VWAP indicate a strong uptrend, while those below suggest a downtrend. By customizing the standard deviation bands, traders can adjust the indicator’s sensitivity to different market conditions.
Volatility Assessment
The standard deviation bands are dynamic, adjusting with market volatility. Narrower bands show low volatility, whereas wider bands point to increased volatility and potential breakouts or reversals.
Signal Alerts for Trading
Traders can capitalize on buy and sell signals based on bars closing beyond the second standard deviation band. These alerts are particularly useful for confirming strong market trends, enabling traders to enter or exit at the most opportune moments.
Customization for Every Strategy
This indicator stands out for its flexibility and ability to adapt to various trading styles:
- Customizable Standard Deviation Multipliers: Adjust the multipliers to increase or decrease the sensitivity of the bands, making the indicator useful for both short-term and long-term strategies.
- Bar Coloring Options: Choose whether to color all bars based on VWAP proximity or highlight only the trend-defining bars.
- Alert System: Customize your alerts to be notified when the market shows strong buy or sell signals.
Conclusion: Why Use the VWAP with Trend Alerts Indicator?
The VWAP with Trend Alerts Indicator provides a complete view of the market by combining the power of VWAP with dynamic standard deviation bands and customizable trend signals. Its flexibility, combined with the ability to generate alerts for key signals, makes it an invaluable tool for traders who want to stay ahead of market moves.
Whether you're gauging trend strength, assessing volatility, or looking for clear buy/sell signals, the VWAP with Trend Alerts Indicator will give you the insights and confidence needed to refine your strategy.
Want more Indicator Spotlights? Check out the Double SuperTrend and Time-Based Alerts