Introducing BBTrend™: A New Indicator from John Bollinger
TradingView, in collaboration with John Bollinger, has launched BBTrend, a new indicator that enhances traditional Bollinger Bands by offering a clearer view of market trends.
Collaborating with Bollinger
TradingView proudly presents BBTrend, a cutting-edge indicator developed by John Bollinger, the creator of Bollinger Bands. Alongside the launch of BBTrend, we have also refined our existing Bollinger Bands indicators under John's meticulous guidance. This collaboration ensures that both new and updated tools meet his exacting standards. Our joint effort has seamlessly incorporated these enhancements into TradingView, enriching our platform with John's expertise and preserving the integrity of his analytical methods.
An Overview of Bollinger Bands®
Bollinger Bands are a staple in technical analysis, primarily used to measure market volatility. They consist of a middle line, usually a simple moving average, with two outer bands representing standard deviations from the average. This setup helps traders identify potential price targets and detect overbought or oversold conditions.
The Value of BBTrend
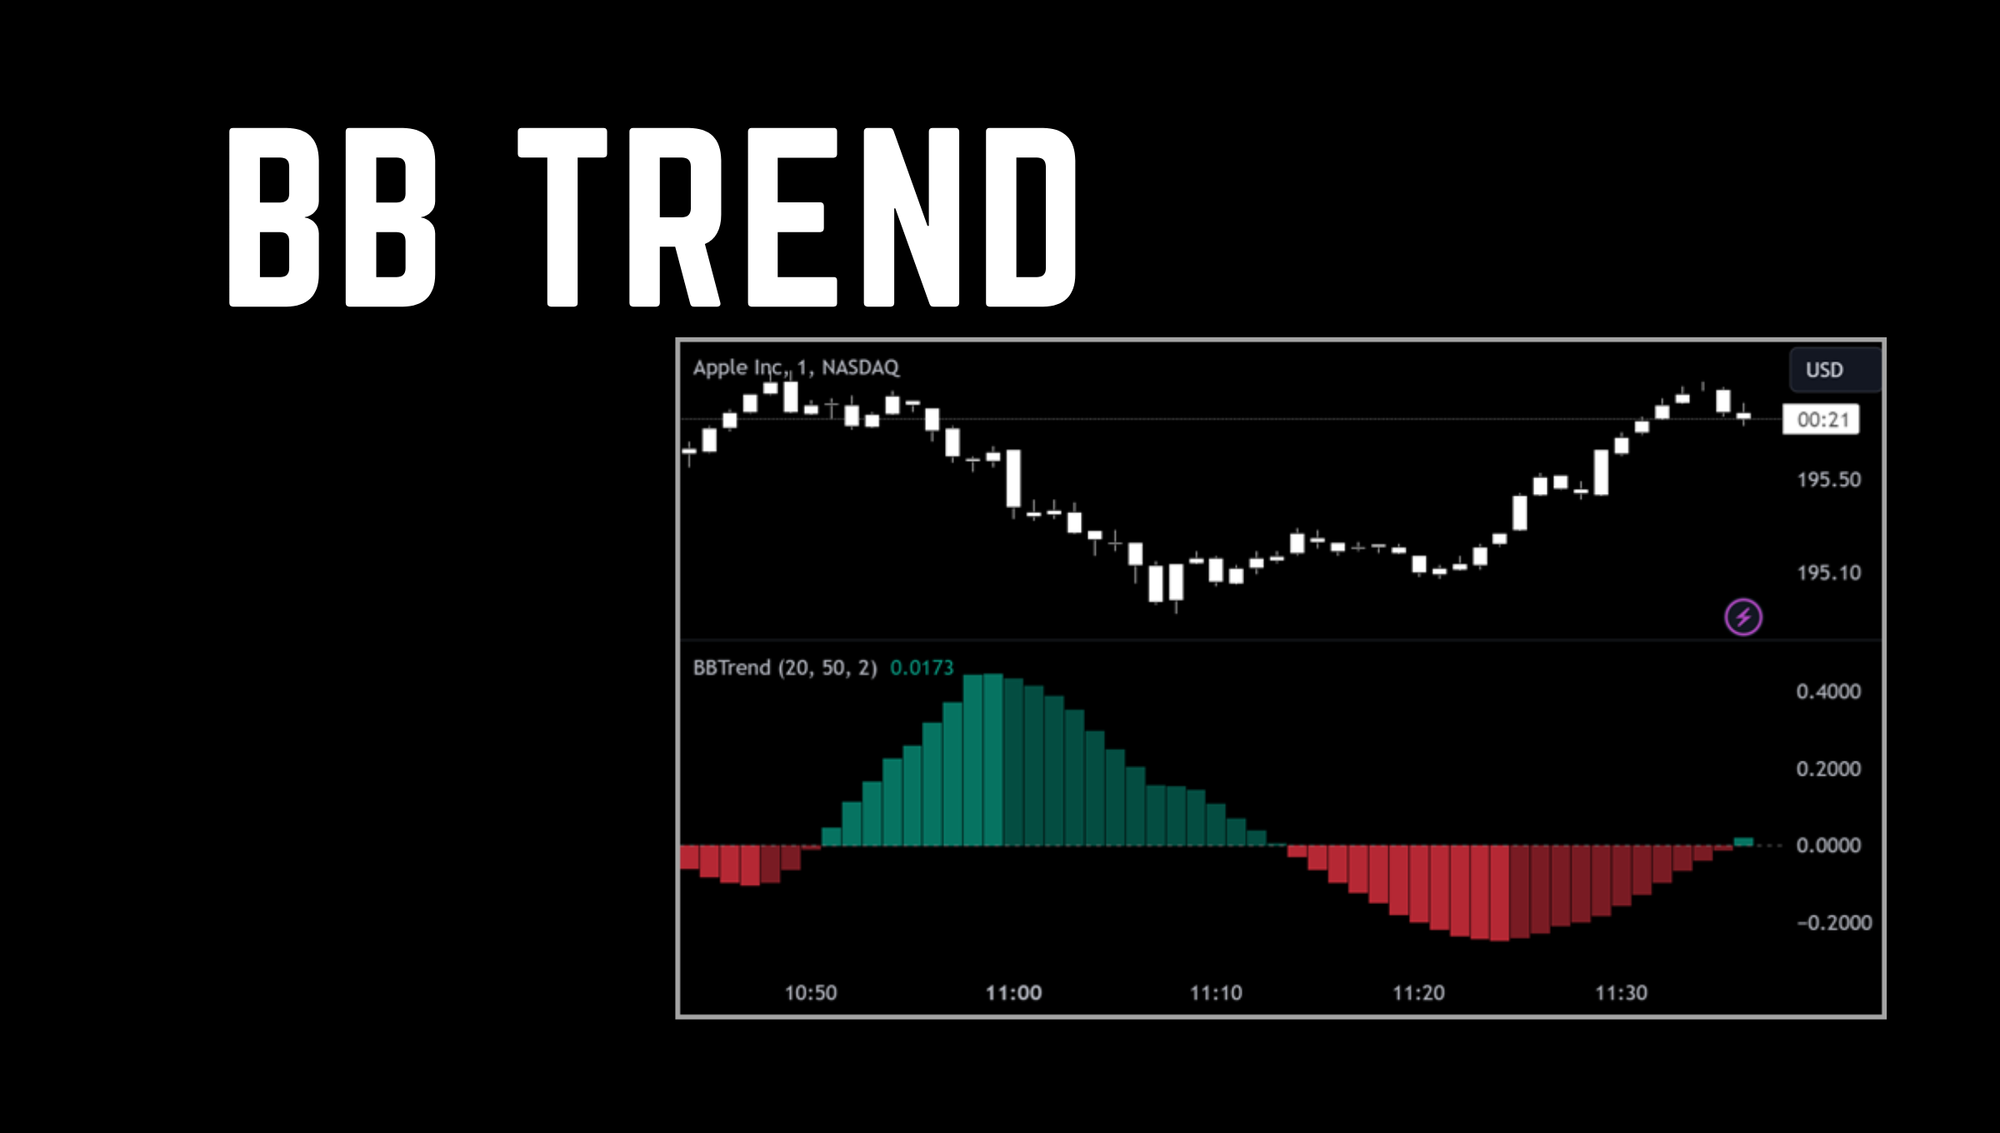
BBTrend advances traditional Bollinger Bands by offering a clearer view of market trends. It analyzes two separate sets of Bollinger Bands — one short-term and one long-term — and displays the results in a histogram format. Positive values indicate a bullish trend, while negative values signify bearish conditions. The distance from zero reflects the trend's strength.
How to Use BBTrend
Incorporating BBTrend into your trading strategy is straightforward. For detailed guidance, you can watch our comprehensive video tutorial, or follow the summarized steps below:
- Customize the Settings: Adjust the lengths of the short and long Bollinger Bands in the BBTrend settings to match your trading preferences and the specific market dynamics you are analyzing.
- Read the Histogram: Monitor the histogram to determine the market trend direction. Positive values indicate a bullish trend, while negative values suggest a bearish trend.
- Assess the Trend Strength: Evaluate the trend’s strength by observing the distance of the histogram bars from the zero line. The further the bars extend from zero, the stronger the trend.
- Identify Potential Trend Reversals: Pay close attention to the peaks and troughs of the histogram. Peaks can signal potential trend highs, while troughs may indicate potential trend lows.
- Observe Color Intensity: Note changes in the color intensity of the histogram bars, as these can indicate shifts in momentum. More intense colors suggest increasing strength, while lighter colors indicate a weakening trend.
Wrapping Up
BBTrend is designed to provide traders with detailed insights into market trends, reinforcing TradingView’s commitment to offering advanced analytical tools. This new indicator, developed through our collaboration with John Bollinger, enhances any trader’s toolkit. We encourage you to explore BBTrend and integrate it into your trading strategies.
To get started with CrossTrade, sign up for a free trial and join the conversation on Discord.