Getting Started with Pine Script v6: Your First Indicator
Build a complete Pine Script v6 indicator from a blank editor: moving averages, adjustable inputs, crossover markers, trend colors and alerts, with the full script at the end.

Every custom tool on a TradingView chart, from a simple moving average to a full trading system, is a Pine Script. Version 6 is the current version, and it's where every new language feature lands.
This guide builds one complete indicator from a blank editor: two moving averages, settings you can change without touching the code, markers where they cross, a background that shows the trend, and alerts you can act on. Each step adds a few lines and explains them, and the full script is at the end.
You don't need programming experience. You need a TradingView account and about twenty minutes.
You can build and plot this indicator before choosing an execution connection. When you want its alerts to place orders, compare the desktop and cloud routes in TradingView webhook automation.
Indicator or strategy: which one are you writing?
Pine Script has two main kinds of script. An indicator calculates and draws: lines, shapes, colors, tables. A strategy does all of that and also simulates trades, so TradingView can backtest it and report results.
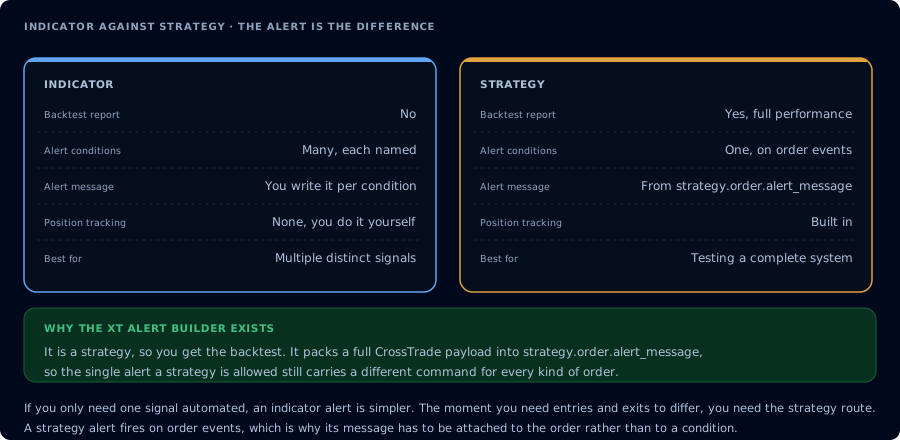
Start with an indicator. It's the simpler of the two, everything you learn carries over to strategies, and plenty of automated traders never need more: an indicator's alerts can trigger orders on their own. When you want a backtest, Pine Script v6 Strategy Code Examples is the next step.
Open the Pine Editor and start a new script
Open any chart and open the Pine Editor. In the current TradingView layout it opens in the side panel; older layouts show it as a tab along the bottom of the chart. From the editor's menu, choose Create new → Indicator.
TradingView fills the editor with a small starter script. Select all of it and delete it, so you're writing from an empty editor and know what every line does.
The two lines every script starts with
Type these two lines:
//@version=6
indicator("MA Crossover", overlay = true)
The first line tells the compiler which version of Pine Script the file uses. Leave it out and TradingView assumes an old version, where half of what follows won't compile. Always start with //@version=6.
The second line declares that this script is an indicator and gives it a name, which is what appears on the chart and in the indicator list. overlay = true draws the indicator on top of the price chart rather than in a separate pane below it. Moving averages belong on price, so overlay is what you want here. An oscillator such as RSI would leave it off.
Plot your first line
Add two lines:
fastMA = ta.sma(close, 20)
plot(fastMA, "Fast MA", color = color.blue)
close is the closing price of each bar. ta.sma(close, 20) is the simple moving average of the last 20 closes; everything in the ta. namespace is a built-in technical analysis function. plot() draws a series as a line, and the second argument is the name it shows in the indicator's settings.
Save with Ctrl+S (Cmd+S on a Mac), then click Add to chart. A blue line follows price.
Here is the idea that makes Pine Script click: the script runs once for every bar on the chart, from the oldest to the newest. You didn't write a loop over bars. You wrote what to do on one bar, and Pine repeats it for each. On the most recent bar, which is still forming, the script runs again every time the price updates.
Make it adjustable with inputs
Hard-coded numbers mean editing the script every time you want a different length. Inputs move them into the indicator's Settings dialog instead. Replace the two lines from the last step with:
fastLength = input.int(20, "Fast length", minval = 1)
slowLength = input.int(50, "Slow length", minval = 1)
src        = input.source(close, "Source")

fastMA = ta.sma(src, fastLength)
slowMA = ta.sma(src, slowLength)

plot(fastMA, "Fast MA", color = color.blue, linewidth = 2)
plot(slowMA, "Slow MA", color = color.orange, linewidth = 2)
input.int() creates a whole-number setting with a default value, a label, and here a minimum of 1 so nobody can enter a zero-length average. input.source() lets you choose what to average: the close by default, but also the open, the high, or the output of another indicator on the chart.
Save, then open the indicator's settings from the chart. Your three inputs are there, and changing one redraws the lines immediately.
Find the crossovers
Two built-in functions do the work:
bullCross = ta.crossover(fastMA, slowMA)
bearCross = ta.crossunder(fastMA, slowMA)
ta.crossover(a, b) is true on the bar where a moves from below b to above it, and false on every other bar. ta.crossunder() is the mirror image. Both give you a bool, a true-or-false value.
Mark those bars on the chart with plotshape():
plotshape(bullCross, "Bullish cross", shape.triangleup, location.belowbar, color.green, size = size.small)
plotshape(bearCross, "Bearish cross", shape.triangledown, location.abovebar, color.red, size = size.small)
A green triangle appears under every bar where the fast average crossed above the slow one, and a red one above every bar where it crossed below.
Turn your TradingView alert into an order
Choose NinjaTrader 8 desktop execution or direct Tradovate cloud routing, then configure the account, order message and exits.
Show the trend with color
One more line tints the background by trend:
bgcolor(fastMA > slowMA ? color.new(color.green, 90) : color.new(color.red, 90))
The ? : operator is a compact if-else: when the condition before ? is true, use the value before :, otherwise the value after it. color.new() takes a color and a transparency from 0 (solid) to 100 (invisible), so 90 is a faint tint that doesn't hide the candles.
If you've seen older scripts use a transp parameter for transparency, it no longer exists in version 6. color.new() is the way to do it now.
Add alerts
An indicator can offer alert conditions that appear in TradingView's alert dialog:
alertcondition(bullCross, "Bullish cross", "Fast MA crossed above slow MA on {{ticker}}")
alertcondition(bearCross, "Bearish cross", "Fast MA crossed below slow MA on {{ticker}}")
Save the script, then create an alert on the chart. In the Condition dropdown, pick your indicator and then Bullish cross or Bearish cross. The third argument becomes the alert's default message, and TradingView replaces {{ticker}} with the chart's symbol when the alert fires.
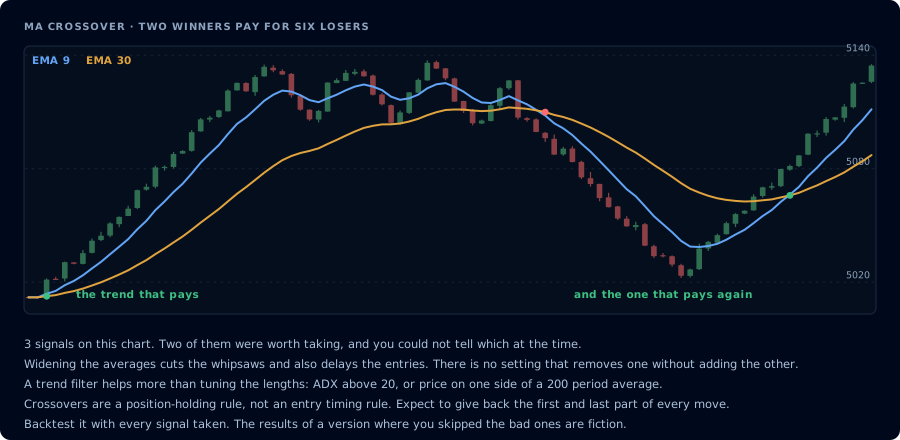
One setting matters more than any other here: the alert's frequency. Set it to Once Per Bar Close. On a bar that's still forming, the averages move with every tick, so a cross can appear mid-bar and vanish before the bar closes. An alert that fires on that cross has acted on a signal your chart will no longer show. Waiting for the close costs a few seconds and removes the problem. Pine Script Repainting explains why this happens and how to test any script for it.
The complete script
//@version=6
indicator("MA Crossover", overlay = true)

// Settings
fastLength = input.int(20, "Fast length", minval = 1)
slowLength = input.int(50, "Slow length", minval = 1)
src        = input.source(close, "Source")

// Calculations
fastMA    = ta.sma(src, fastLength)
slowMA    = ta.sma(src, slowLength)
bullCross = ta.crossover(fastMA, slowMA)
bearCross = ta.crossunder(fastMA, slowMA)

// Drawing
plot(fastMA, "Fast MA", color = color.blue, linewidth = 2)
plot(slowMA, "Slow MA", color = color.orange, linewidth = 2)
plotshape(bullCross, "Bullish cross", shape.triangleup, location.belowbar, color.green, size = size.small)
plotshape(bearCross, "Bearish cross", shape.triangledown, location.abovebar, color.red, size = size.small)
bgcolor(fastMA > slowMA ? color.new(color.green, 90) : color.new(color.red, 90))

// Alerts
alertcondition(bullCross, "Bullish cross", "Fast MA crossed above slow MA on {{ticker}}")
alertcondition(bearCross, "Bearish cross", "Fast MA crossed below slow MA on {{ticker}}")
Lines starting with // are comments. Pine ignores them; they're there so the script still makes sense to you in three months.
Three version 6 rules that trip up beginners
If you copy code from older tutorials, these are the changes most likely to bite.
Dividing two whole numbers keeps the fraction. In version 6, 5 / 2 is 2.5. Older versions gave 2. If you want a whole number, round it yourself with math.floor() or math.round().
Numbers are no longer true or false on their own. Older scripts sometimes wrote if volume to mean "if volume isn't zero". Version 6 rejects that. Write the comparison you mean, if volume > 0, or convert explicitly with bool().
A true-or-false value is never na. In version 6, a bool is always either true or false, and na() no longer accepts one. It makes conditions simpler, but it breaks older code that checked a bool for na.
Where to go next
You've now used the core of Pine Script: a version line, a declaration, inputs, built-in functions, plots, shapes, colors and alerts. Most indicators are more of the same.
The next concepts to learn are Pine's data types, how a value can survive from one bar to the next, and where a variable can be seen. To put your indicator's own values into an alert message, such as the price of the cross, see Using Pine Script Variables.
When you want those alerts to place trades, the alert message becomes an order. How to Build Webhook Messages Inside Pine Script shows how to build one in code, and CrossTrade sends it to NinjaTrader 8 or Tradovate.
Frequently asked questions
Do I need a paid TradingView plan to write Pine Script?
No. The Pine Editor is available on every plan, including the free Basic plan, and you can add your own scripts to a chart. Alerts on your indicator and webhook alerts need a paid plan.
What is the difference between an indicator and a strategy in Pine Script?
An indicator calculates and draws on the chart. A strategy also simulates trades, so TradingView can backtest it and show results. Scripts start with indicator() or strategy() to say which one they are.
What does //@version=6 do?
It tells TradingView's compiler the script is written in Pine Script version 6. Without it, the script is compiled as an older version and version 6 code fails.
Why did my indicator's alert fire on a signal that is no longer on the chart?
The signal appeared on a bar that was still forming and disappeared before the bar closed. Set the alert frequency to Once Per Bar Close so it only fires on confirmed bars.
Can I automate trades from a Pine Script indicator?
Yes. An indicator's alert can send a webhook, and CrossTrade turns that webhook into an order on NinjaTrader 8 or Tradovate. Test it on a simulation or demo account first.
Build it, then automate it
New to CrossTrade? Start your free 7-day trial and send your first indicator alert to a simulation account. Pine questions are welcome in the CrossTrade Discord.
CrossTrade is execution and automation software, not a broker, financial adviser, or trading strategy. Pine Script features and plan requirements are set by TradingView and change. Futures trading involves substantial risk. Test every automated workflow in simulation and verify orders at your broker.