TradingView Rolls Out Two Game-Changing Bar Replay Features
Check out two new updates to TradingView's Bar Replay feature: Heikin Ashi candles and 1 second precision!

TradingView just dropped two updates to their Bar Replay feature that actually matter. For those unfamiliar, TradingView is the charting platform that's become the standard for retail traders worldwide, while CrossTrade focuses on trade execution with TradingView's webhook alert system. These new Bar Replay enhancements are worth paying attention to because they make backtesting significantly more precise.
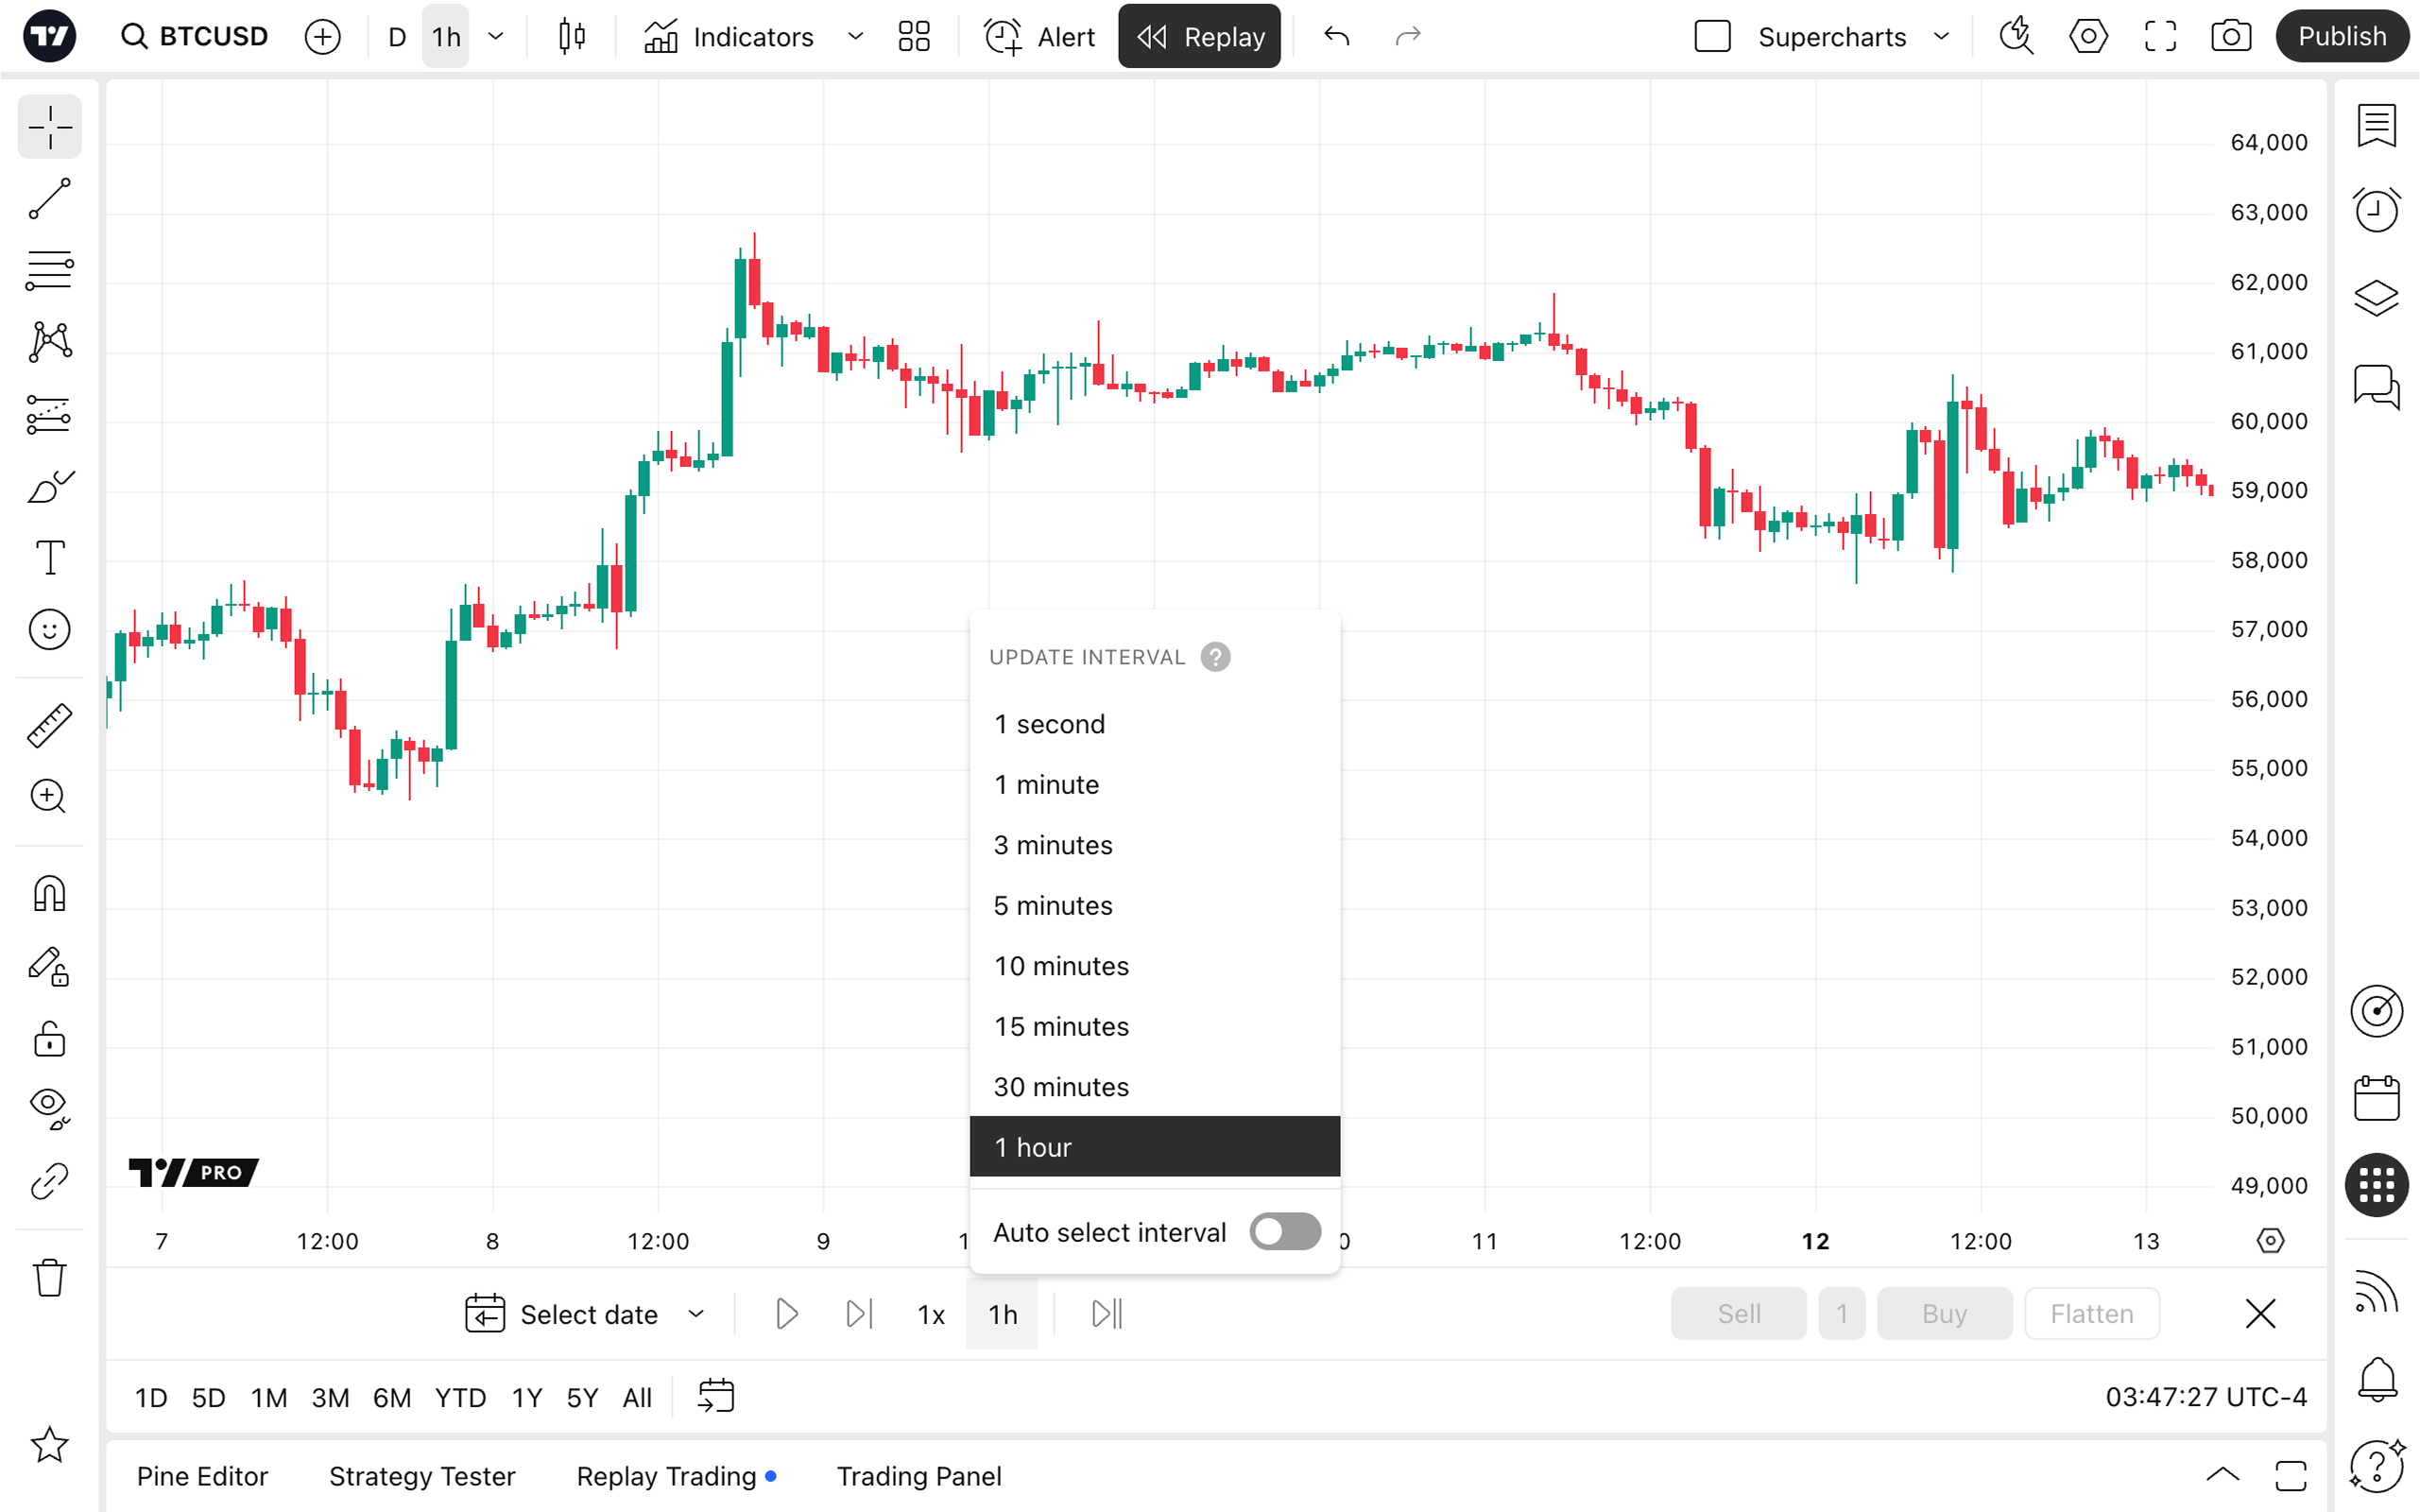
1-Second Precision: Because Every Tick Matters
The first upgrade brings 1-second update intervals to Bar Replay across all intraday charts. This isn't just a numbers game. When you're testing scalping strategies or trying to nail down entries on lower timeframes, those seconds between price updates can completely distort your results.

Previously, Bar Replay moved in larger chunks that could skip over crucial price action. Now you can watch how your strategy would have performed second by second, which gives you a much clearer picture of what actually happened during volatile moments. If you've ever wondered why your backtested strategy looked perfect but failed in live trading, timing precision like this often reveals the answer.
The feature is available to Essential plan subscribers and above, so it's not locked behind their premium tiers.
Heikin Ashi Integration: Smoother Backtesting
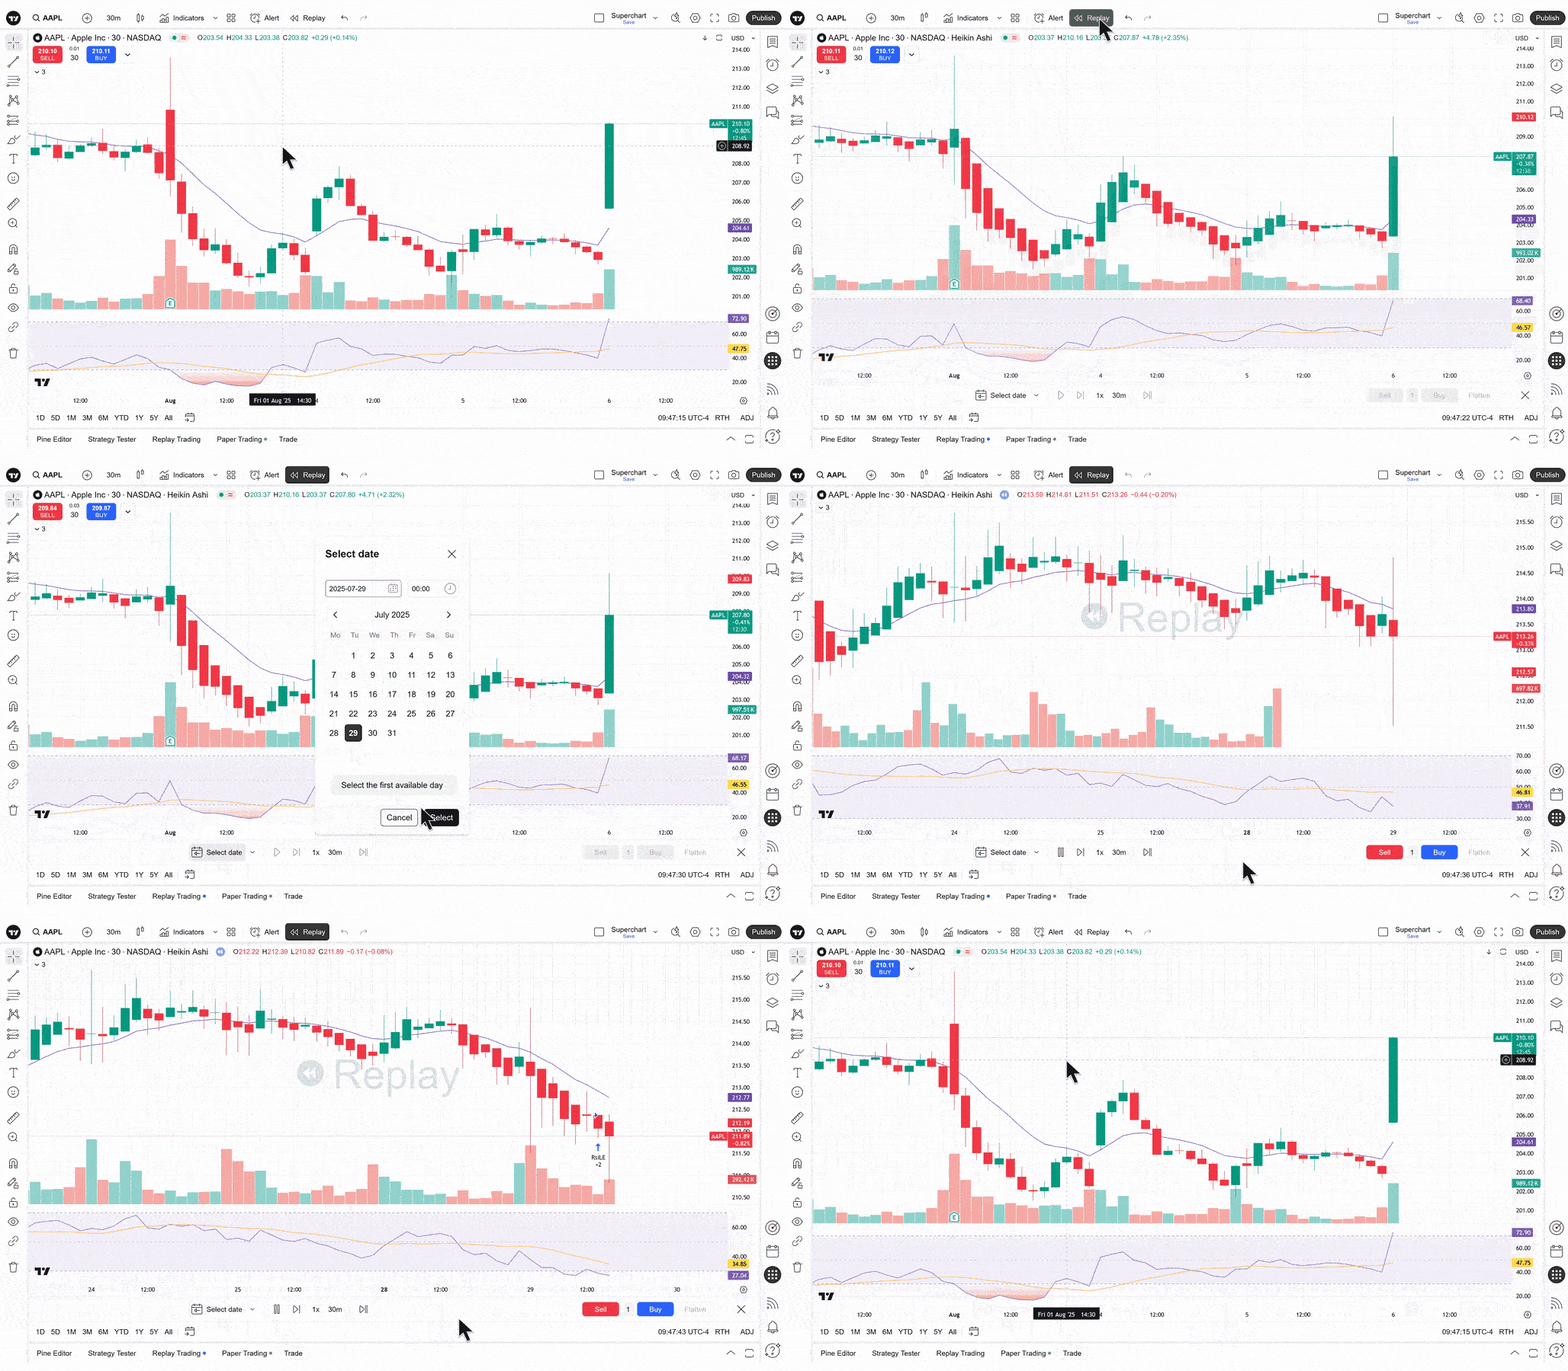
The second update integrates Heikin Ashi candles into Bar Replay. For traders who rely on Heikin Ashi's smoothed price action to filter out market noise, this was a notable gap in TradingView's toolkit.
Heikin Ashi candles use averaged price data rather than raw open, high, low, close values. This creates cleaner trend visualization and reduces false signals that plague traditional candlestick analysis. The trade-off is that you lose some granular price information, but many trend-following strategies benefit from this smoothing effect.

Being able to step through historical data using Heikin Ashi means you can now test whether your strategy actually works better with smoothed price action versus traditional candles. You might discover that what looked like a solid setup on regular candles was just noise that Heikin Ashi would have filtered out.
Why This Matters for Your Trading
These aren't flashy features, but they solve real problems. The 1-second intervals help with precision timing, while Heikin Ashi integration lets you backtest with the same price visualization you trade with. If you use different chart types for analysis and backtesting, you're introducing variables that can skew your results.
Both features work together too. You can now step through Heikin Ashi charts second by second, giving you the smoothed trend view with precise timing. That combination should help identify whether your entries and exits are actually as good as you think they are.
For traders serious about strategy development, these updates make TradingView's backtesting capabilities more aligned with real trading conditions. Not revolutionary, but definitely useful improvements that address actual workflow issues.
Looking to automate your TradingView strategies?


