TradingView Introduces Tick Charts in Beta
TradingView announces the long awaited feature Tick Charts are now available in Beta to Professional tier plans.
TradingView has just announced the long awaited roll out one of its most requested features: tick charts. Unlike traditional time-based charts, tick charts build bars based on the number of trades rather than fixed time intervals. This means each bar represents a predetermined number of transactions, regardless of how much time has passed, giving traders a more detailed view of market dynamics.
Tick charts are particularly useful for those who want a clearer picture of market activity. They provide insights into when the market is buzzing with trades or when it’s relatively quiet. Additionally, tick charts offer a more nuanced perspective on price movements, trends, and trading volume, making them a valuable tool for quicker decision-making, especially in fast-moving markets. When the market is volatile, tick charts can deliver a clearer visualization of trading actions compared to time-based charts.
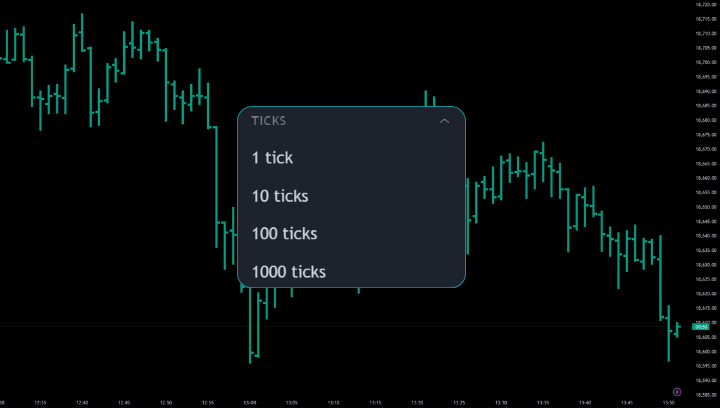
For those with a Professional-tier plan—Expert, Elite, or Ultimate—you can start experimenting with tick charts right away. Currently, you can choose from four tick intervals: 1T, 10T, 100T, and 1000T. To open a tick chart, simply type the interval on your keyboard while your chart is open, or select your preferred tick-based interval from the Time interval dropdown menu.
Please be aware that not all exchanges support tick data at this time. You can check the latest list of supported exchanges and learn more about the benefits and limitations of tick charts by visiting the tick-based intervals article.
Understanding Tick-Based Intervals
Tick-based intervals differ from traditional time-based charts by constructing bars from a set number of trades rather than fixed time periods. This method offers a more detailed snapshot of market fluctuations, which is especially beneficial for day traders aiming to capitalize on short-term price movements.
What You’ll Learn from This Article
This article will cover everything you need to know about tick charts, including:
- What tick-based charts are
- The benefits of using tick charts
- What being in BETA means
- Available tick intervals
- Who can access this feature
- How to set up a tick-based chart
- Which exchanges provide tick data
- How much historical tick data is available
- Whether tick-based intervals are supported in Pine scripts
- Additional functionalities and limitations
What Are Tick-Based Charts?
Unlike time-based charts, where each bar represents a specific time frame (like 30 seconds), tick charts build bars based on the number of consecutive trades. For example, on a 10-tick chart, a new bar forms after every 10 trades. Each tick includes information such as price, time, and volume, with the resulting bar showing the open, high, low, and close prices for that group of ticks. The time it takes to form a bar can vary—sometimes it might take seconds, while other times it could take hours or even days.
Importantly, tick-based bars align with the start of the trading session. This means that a new bar will begin at the session’s start, even if the previous bar hasn’t yet accumulated the required number of ticks.
Why Use Tick Charts?
Tick charts offer several key advantages:
Detailed Market Activity: By forming bars based on transactions rather than time, tick charts can highlight periods of high or low market activity more clearly.
Enhanced Price Action and Trend Analysis: These charts provide a sharper view of price movements, trends, and volume, which can help traders make quicker, more informed decisions. This is particularly useful for strategies like scalping, where traders aim to profit from small, quick trades.
Better Visualization During Volatility: In times of high market volatility, tick charts offer a more refined view of trading actions compared to time-based charts.
Understanding BETA
Tick charts are currently in their BETA phase, meaning they’re available to users but still under development. TradingView is actively seeking feedback to improve this feature and make it even more effective for our users. If you encounter any issues or have suggestions, please let us know by submitting a support ticket.
Available Tick Intervals
Currently, you can choose from the following tick intervals: 1T, 10T, 100T, and 1000T. This allows you to view a chart that updates after each tick or after 10, 100, or 1,000 ticks.
Who Can Access Tick Charts?
Tick charts are available exclusively to users on Professional-tier plans, including Expert, Elite, and Ultimate.
How to Set Up a Tick-Based Chart
Tick-based intervals are supported on all standard chart types (like Bars, Candles, Line, etc.) and Heikin Ashi charts. To use tick-based charting, select a supported chart type and then choose a tick interval from the menu above the chart. Alternatively, you can type the tick interval (like 1T or 10T) directly into the chart and press Enter.
Historical Tick Data
The amount of historical tick data you can access depends on your TradingView subscription level and the chart's symbol. Expert plans can access up to 25,000 historical bars, Elite plans up to 30,000 bars, and Ultimate plans up to 40,000 bars. For continuous futures, data is limited to the current and previous contracts only.
Pine Script Compatibility and Additional Information
Tick-based intervals are fully compatible with Pine scripts, allowing you to use your custom indicators and strategies on tick charts, provided you have a Professional plan.
Additional Functionalities and Limitations
- Tick data is available for the most popular exchanges.
- Tick intervals are pre-set and cannot be customized.
- Bar Replay and Deep Backtesting aren’t available for tick-based intervals.
- Non-standard chart types like Renko, Line Break, Kagi, and PnF are not yet supported.
- Server-side alerts for tick-based intervals are currently unavailable.
- Tick-based charts are not yet available in mobile apps.
- Public ideas using tick charts cannot be published.
We're looking forward to exploring tick charts further and what automated strategies can be developed using this new feature. Was this article helpful? If you have any more questions or feedback, don’t hesitate to reach out.