TradingView’s New Global Charts Unlock Deeper Market Insights.
Discover TradingView's new Economic Charts—10 pages of global insights on inflation, GDP, employment, and more. Visualize trends and sharpen your strategies with clear, data-driven tools.
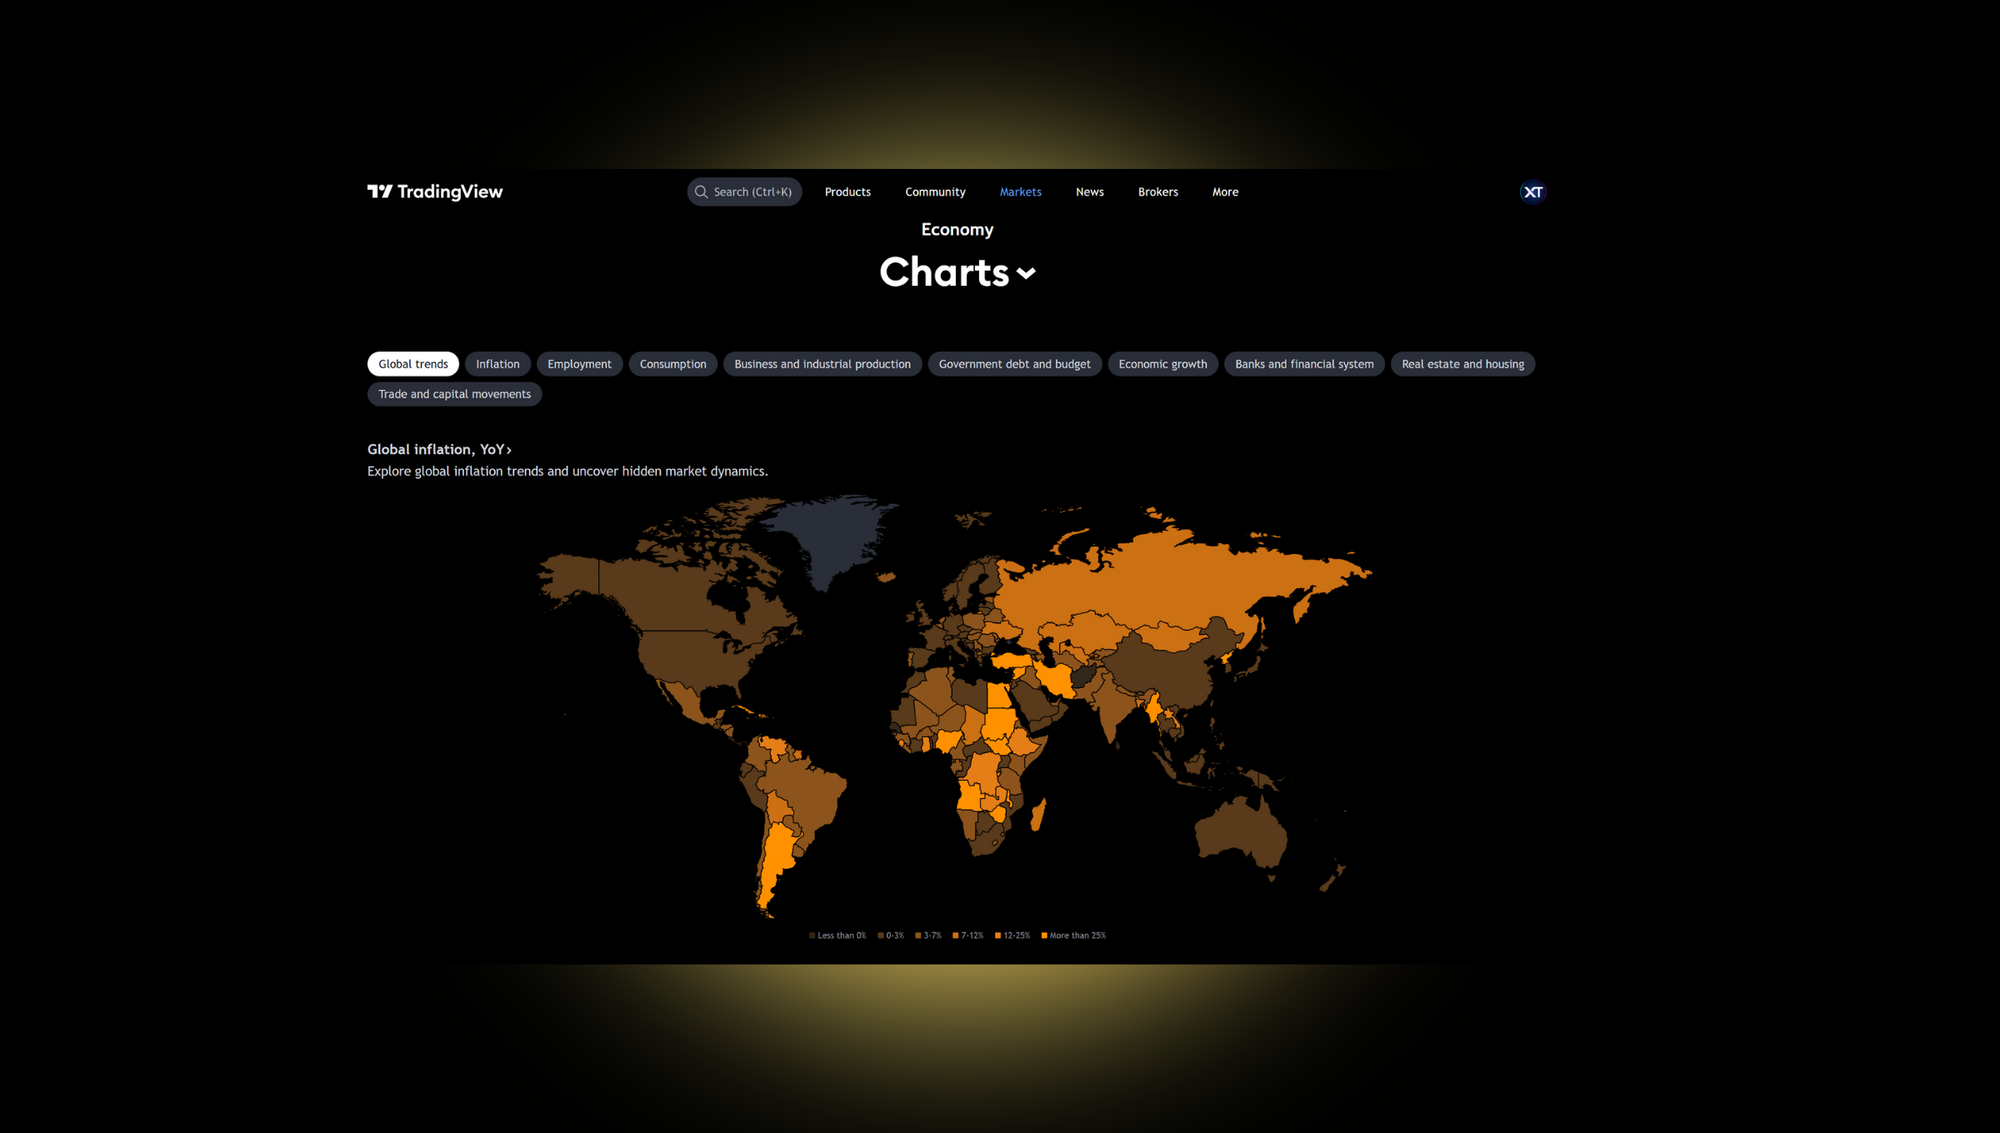
We’re excited to spotlight TradingView’s latest release—a powerful new section called Economic Charts. With this update, TradingView provides an extensive collection of data-driven visuals that highlight key global economic trends, making it easier than ever to make well-informed decisions in today’s interconnected markets.
What’s New in TradingView’s Economic Charts?
TradingView’s new feature offers 10 detailed pages designed to help you analyze the world economy from every angle. Here’s a breakdown of what you can expect:
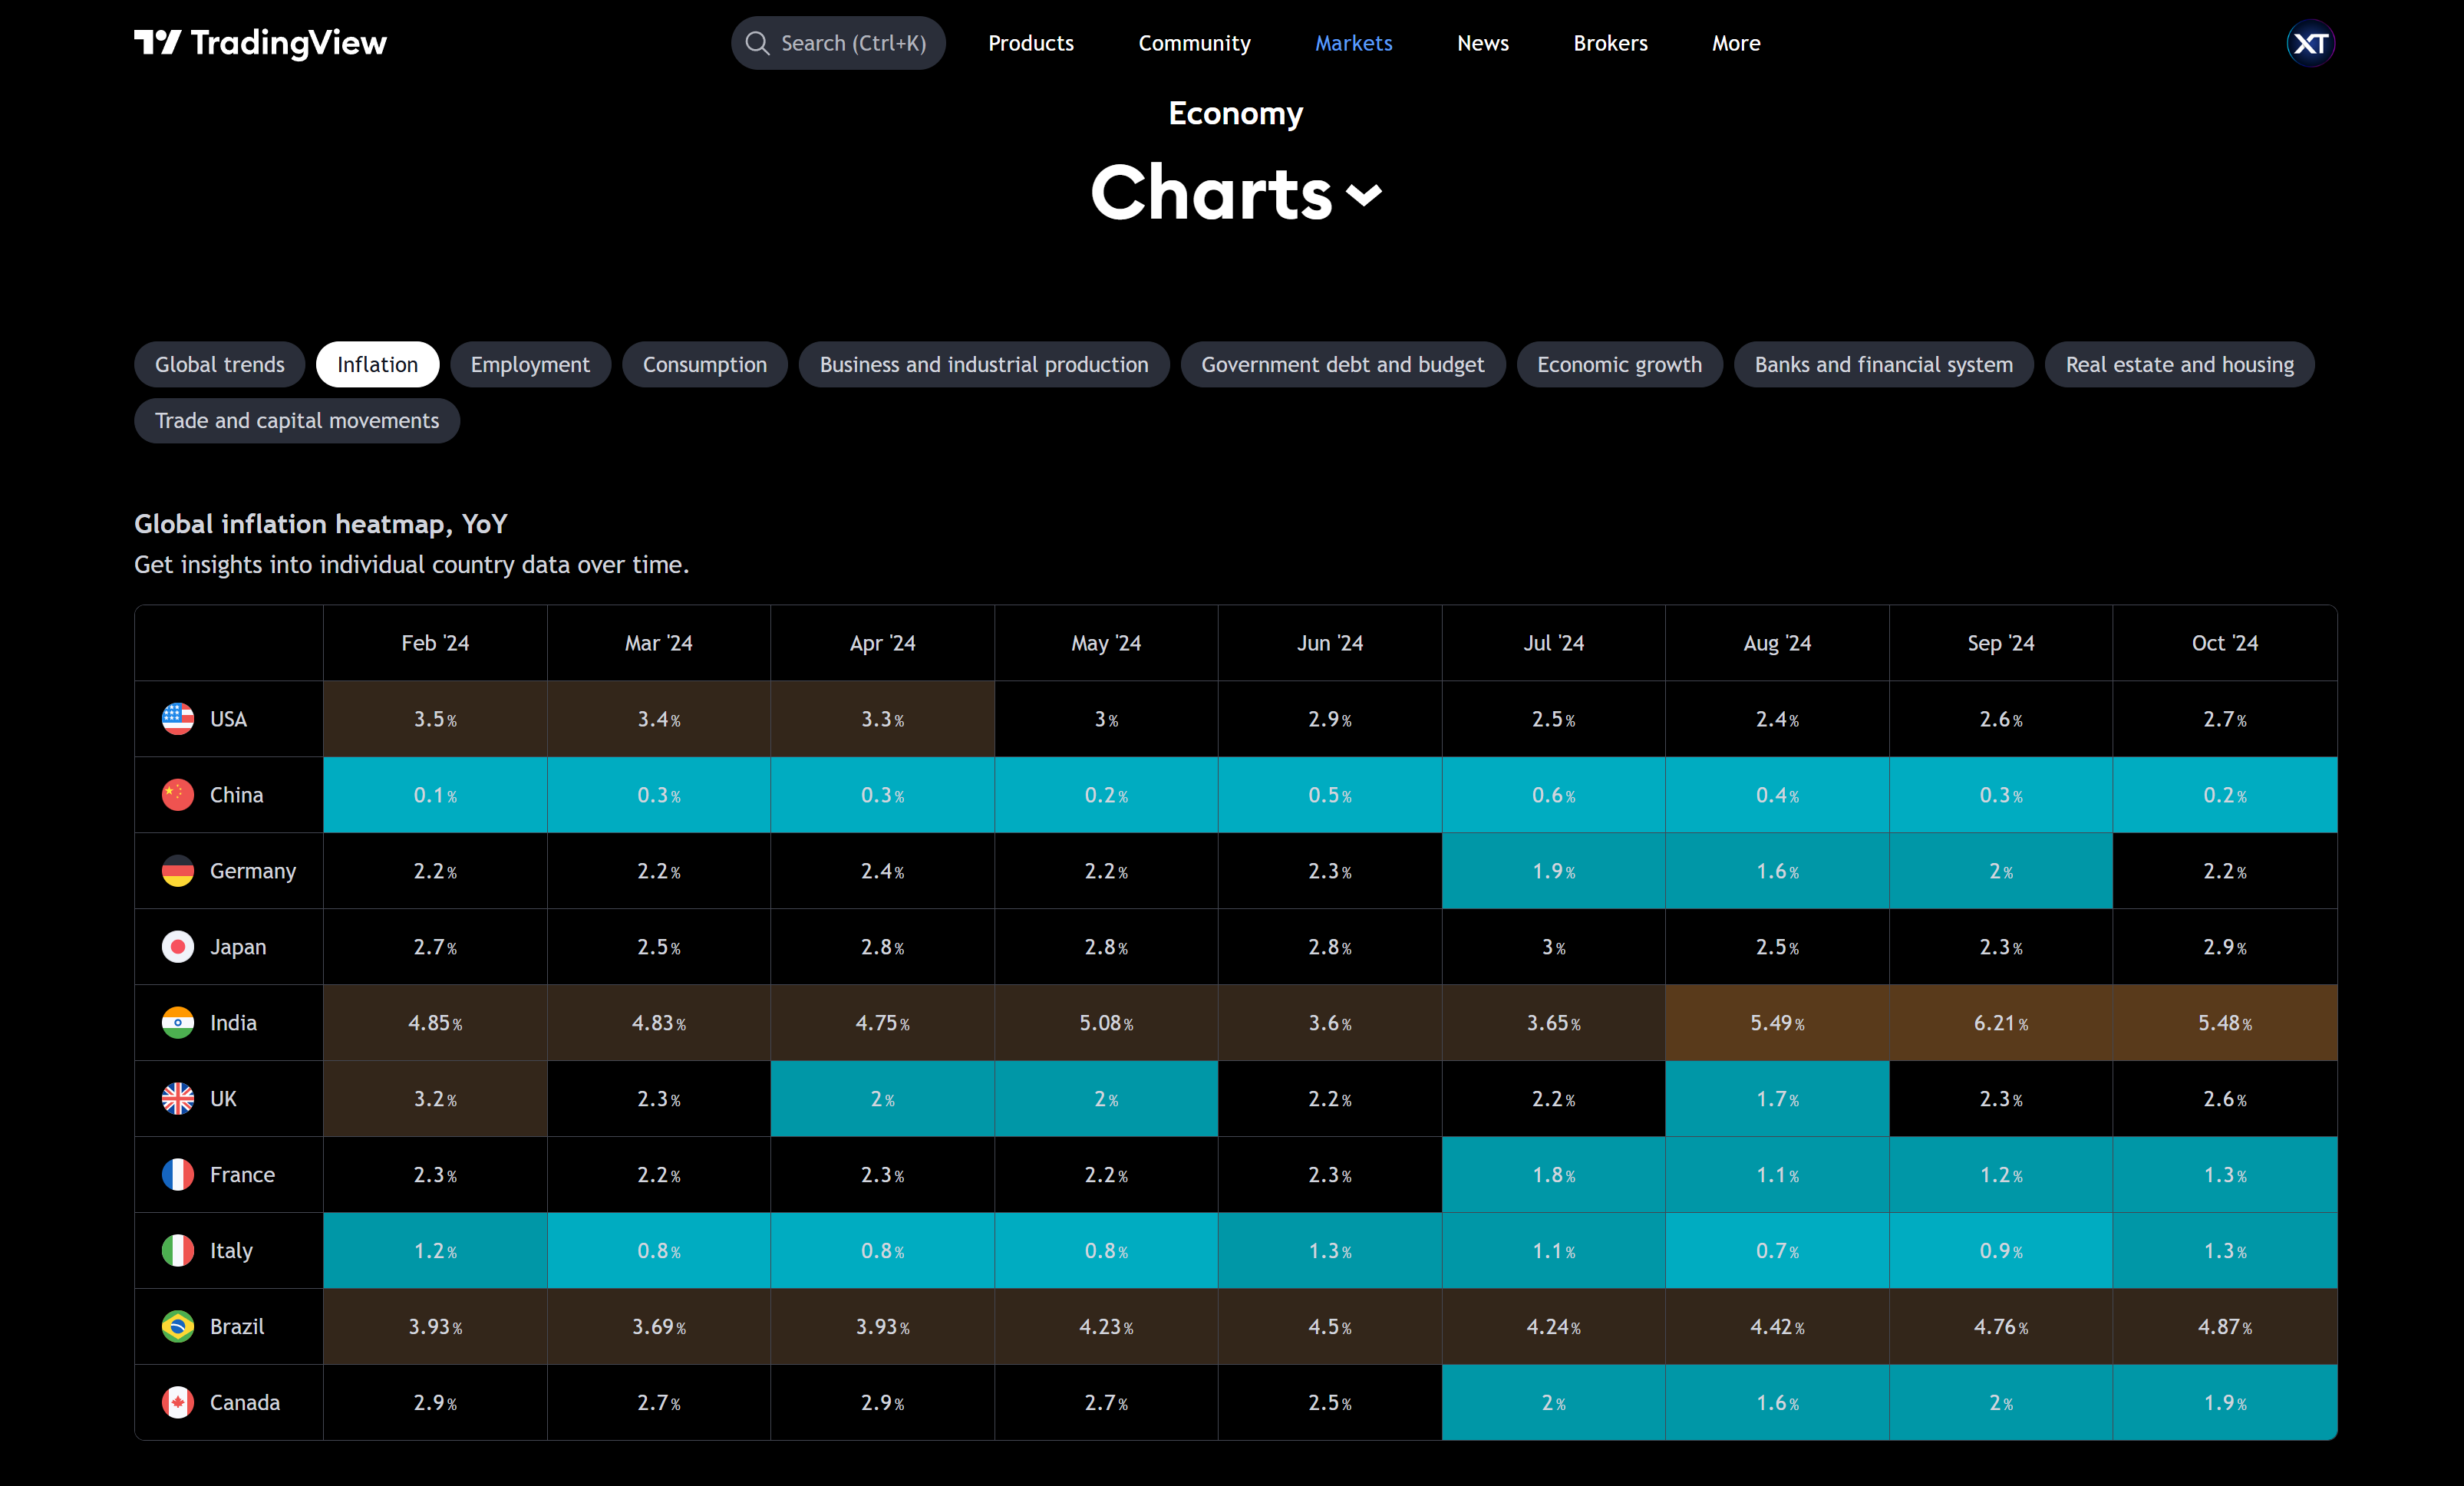
Global Inflation Heatmap
Easily identify inflation trends across major countries with a clear, intuitive heatmap.
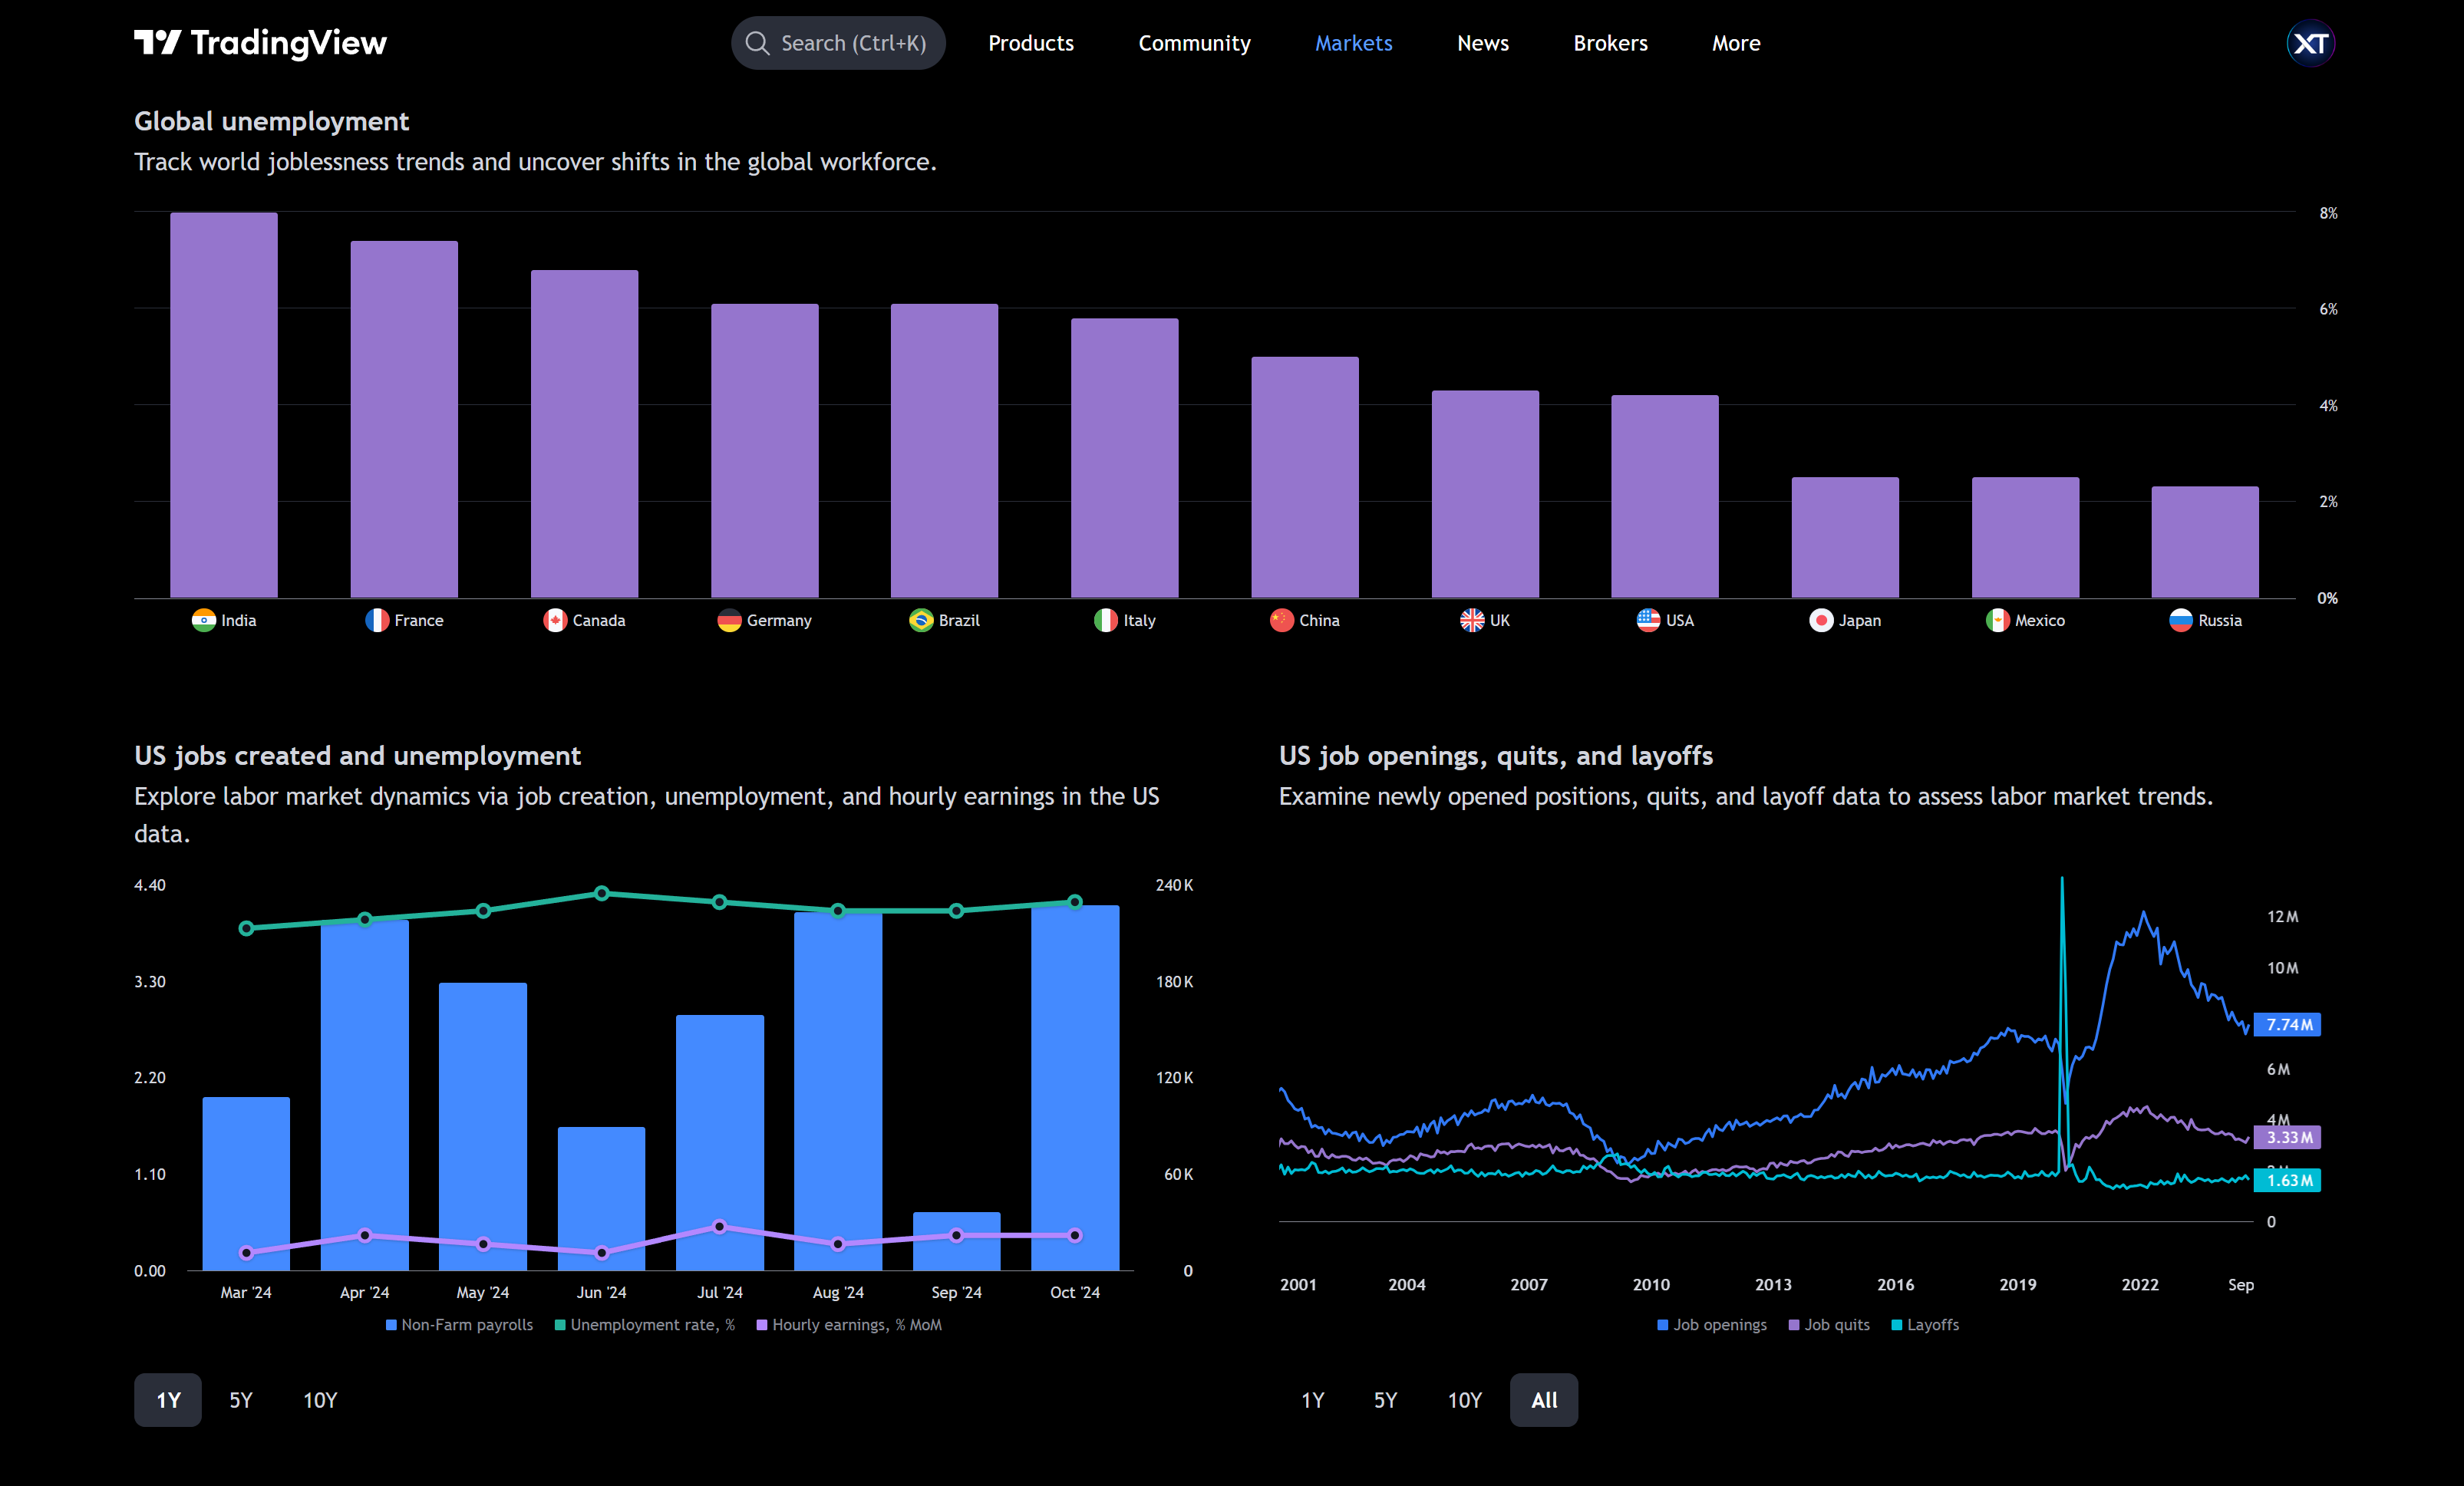
Employment Overview
Track global unemployment rates and get a sense of where labor markets are headed.
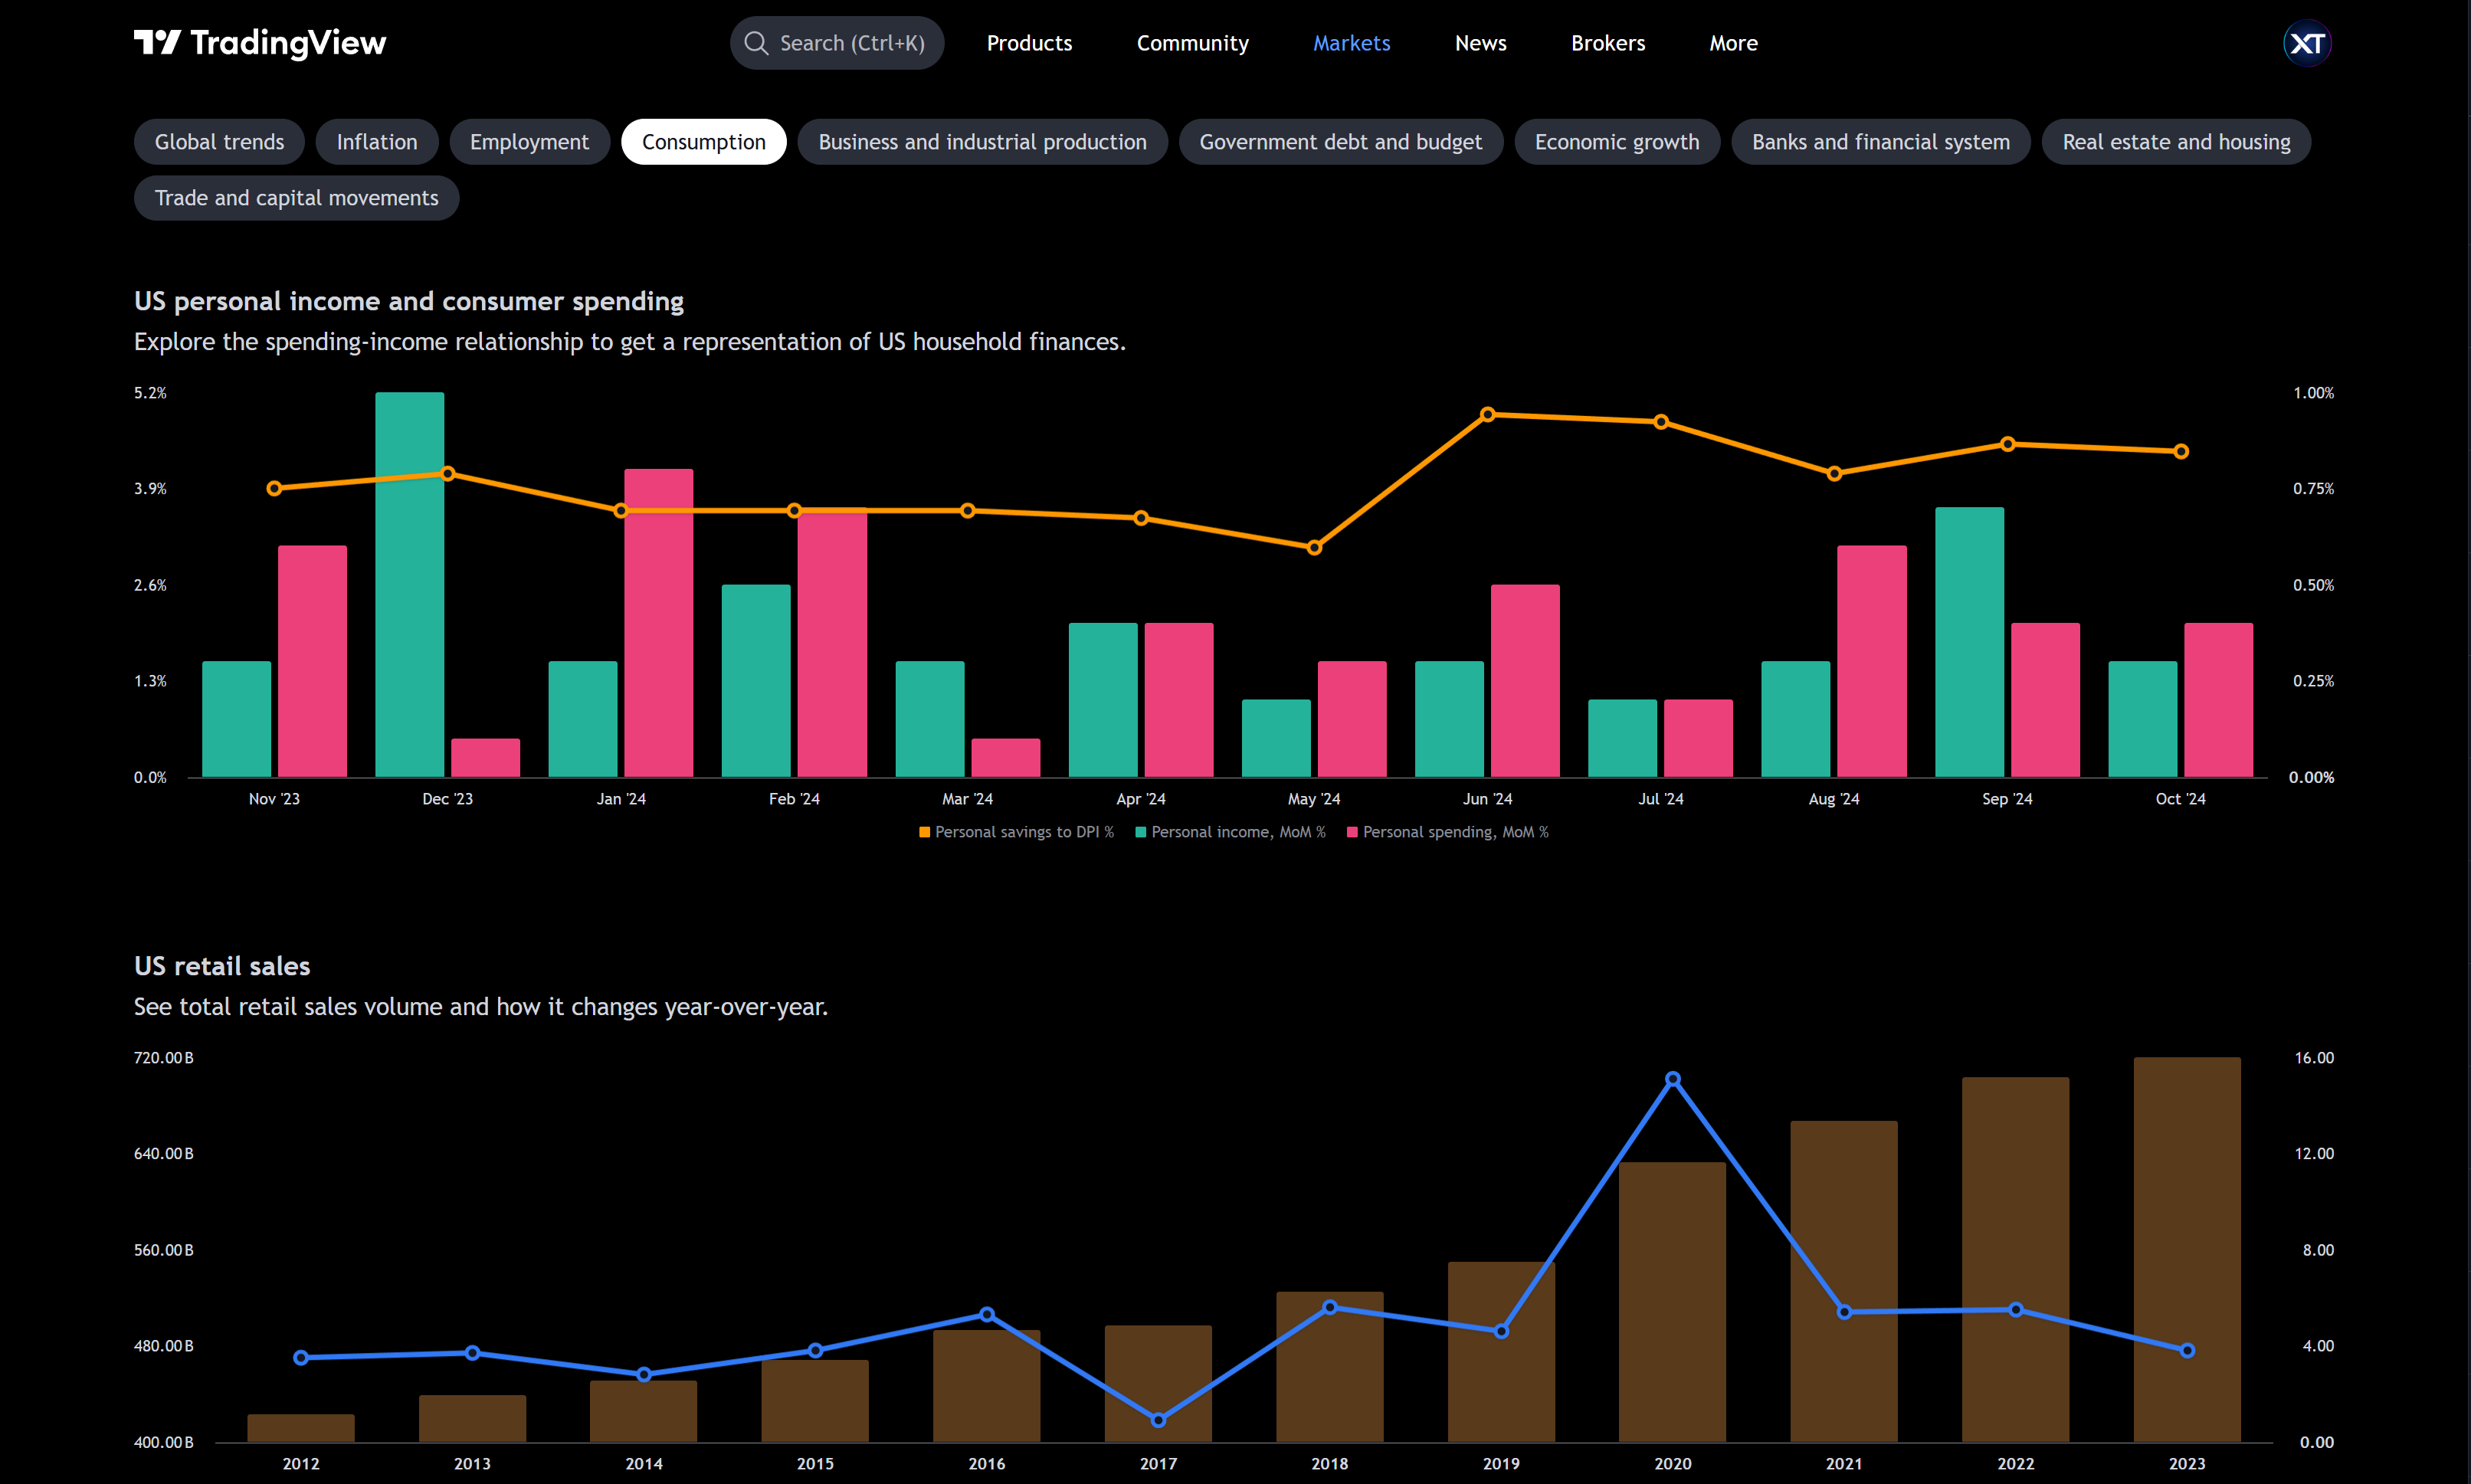
Consumer Behavior Insights
Monitor shifts in consumer spending to uncover demand-side trends and opportunities.
Production and Business Trends
Keep tabs on manufacturing activity and business performance on a global scale.
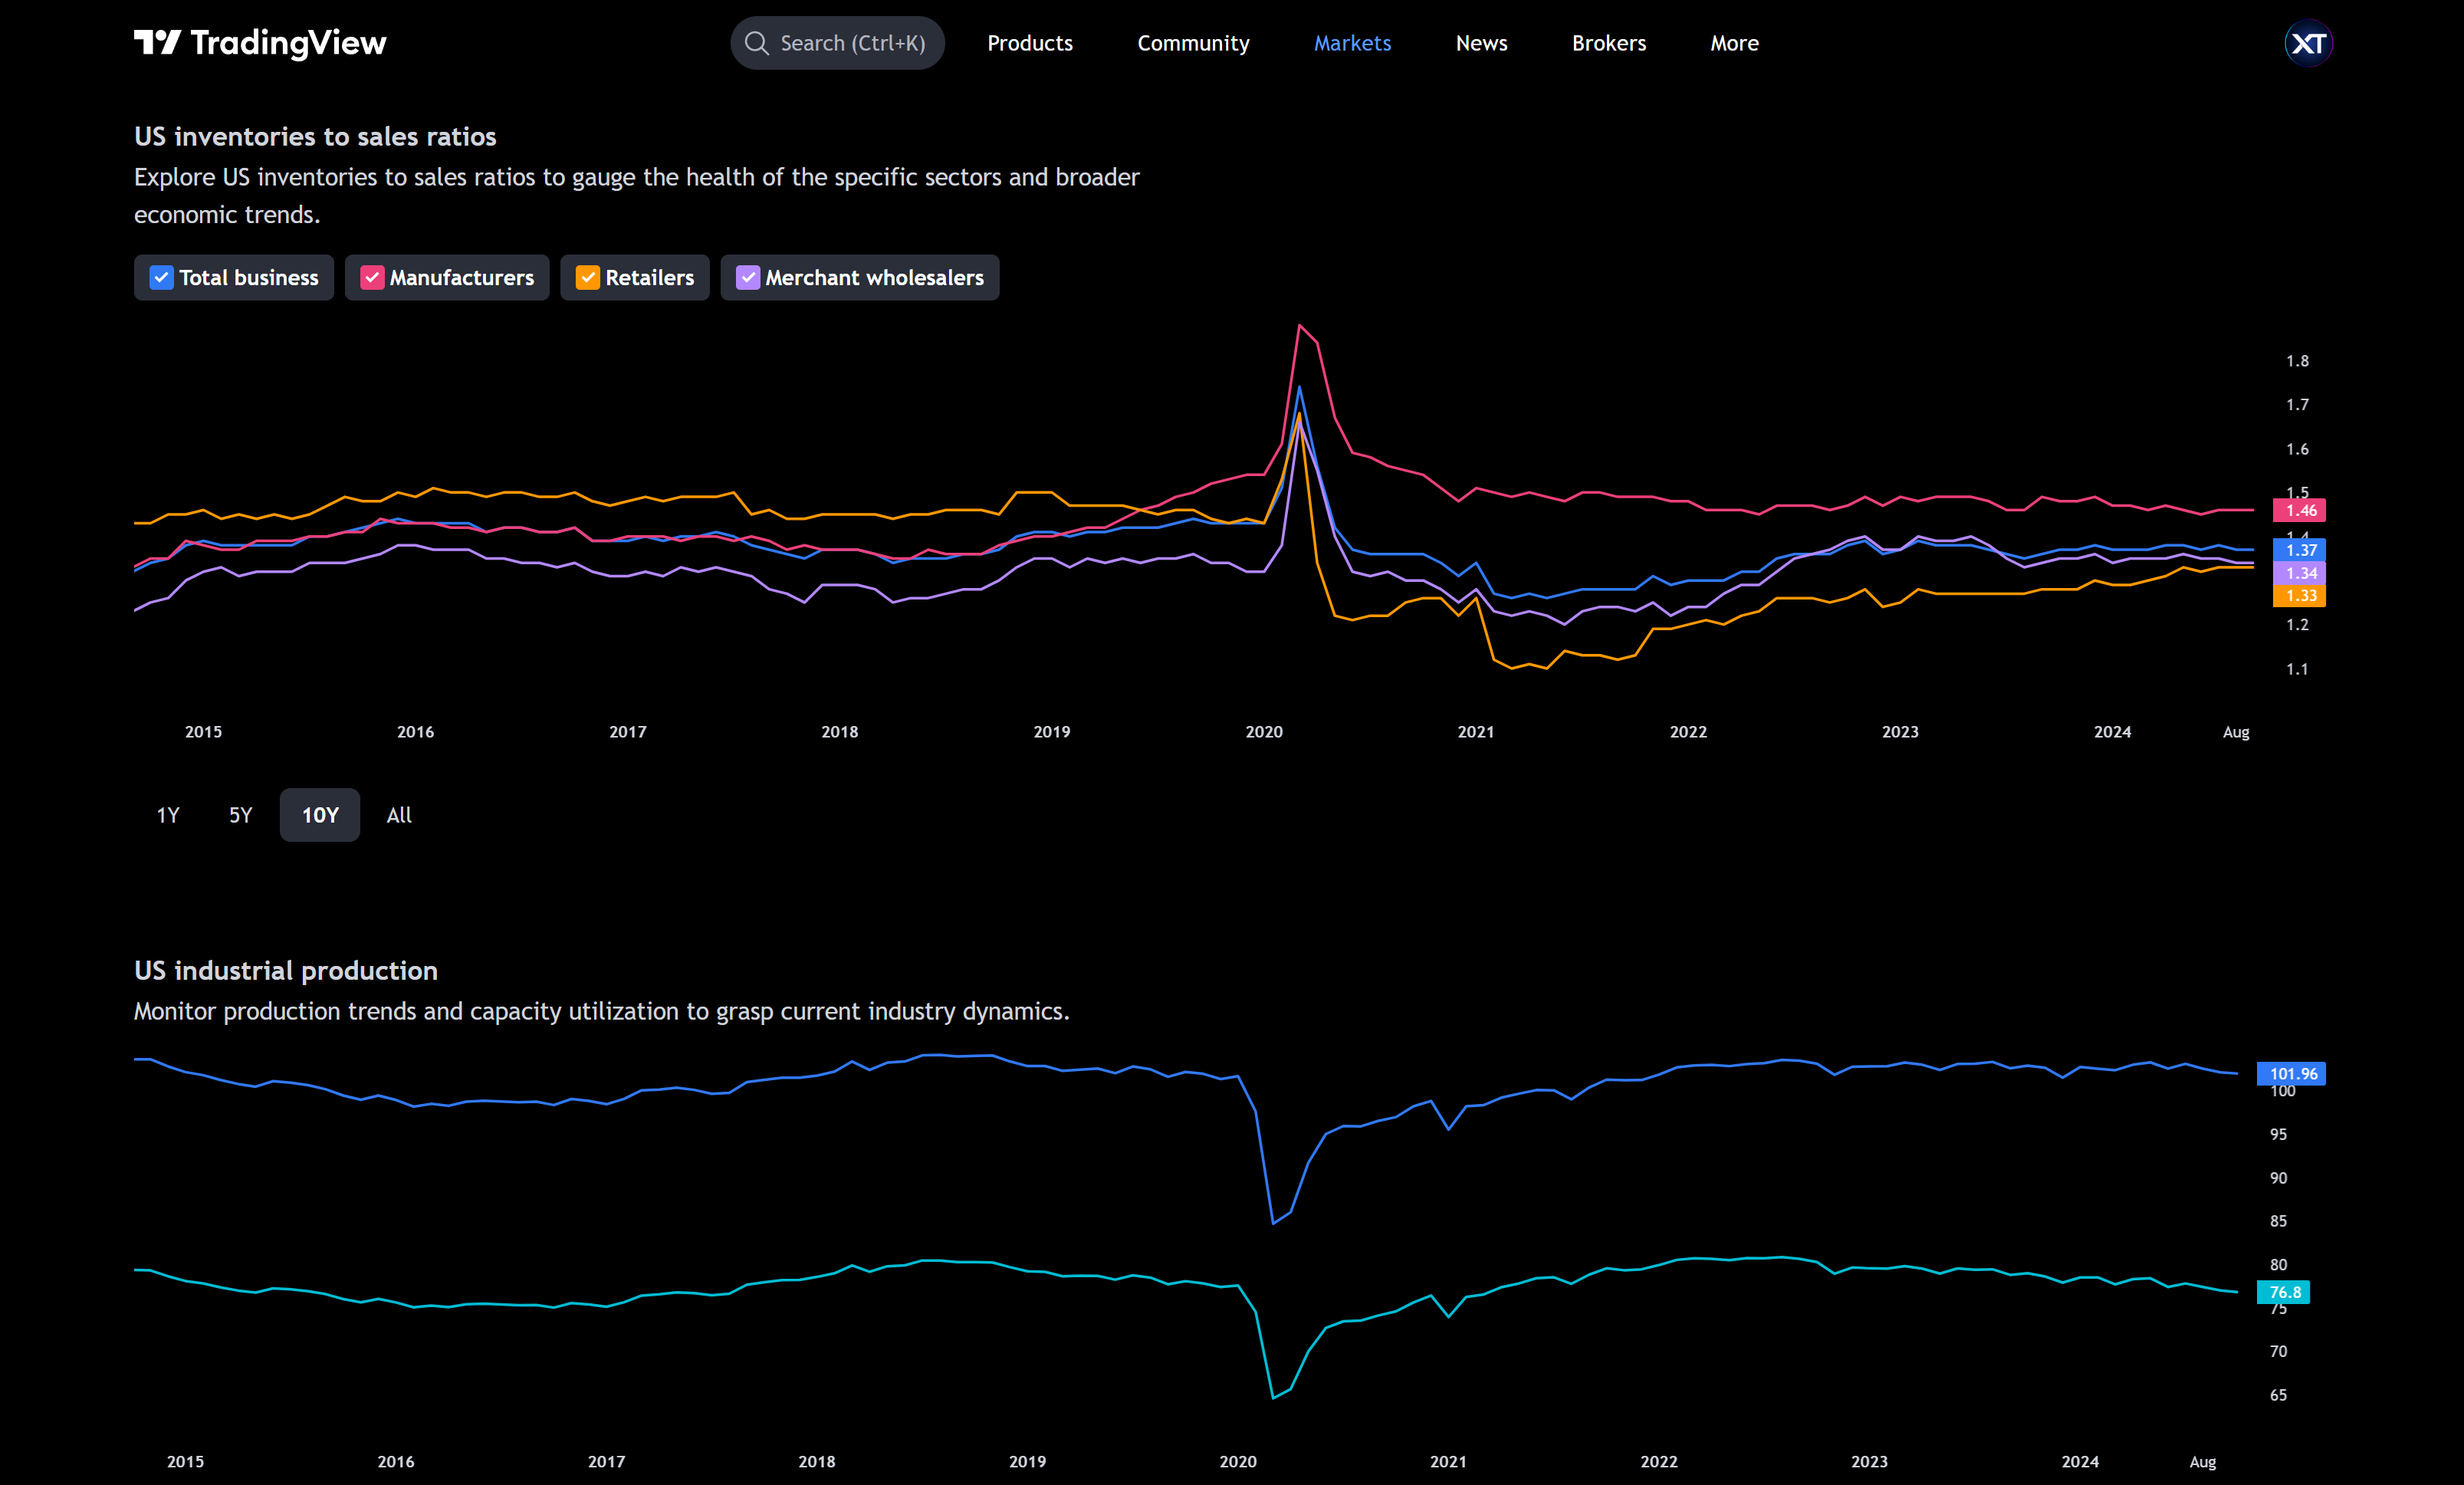
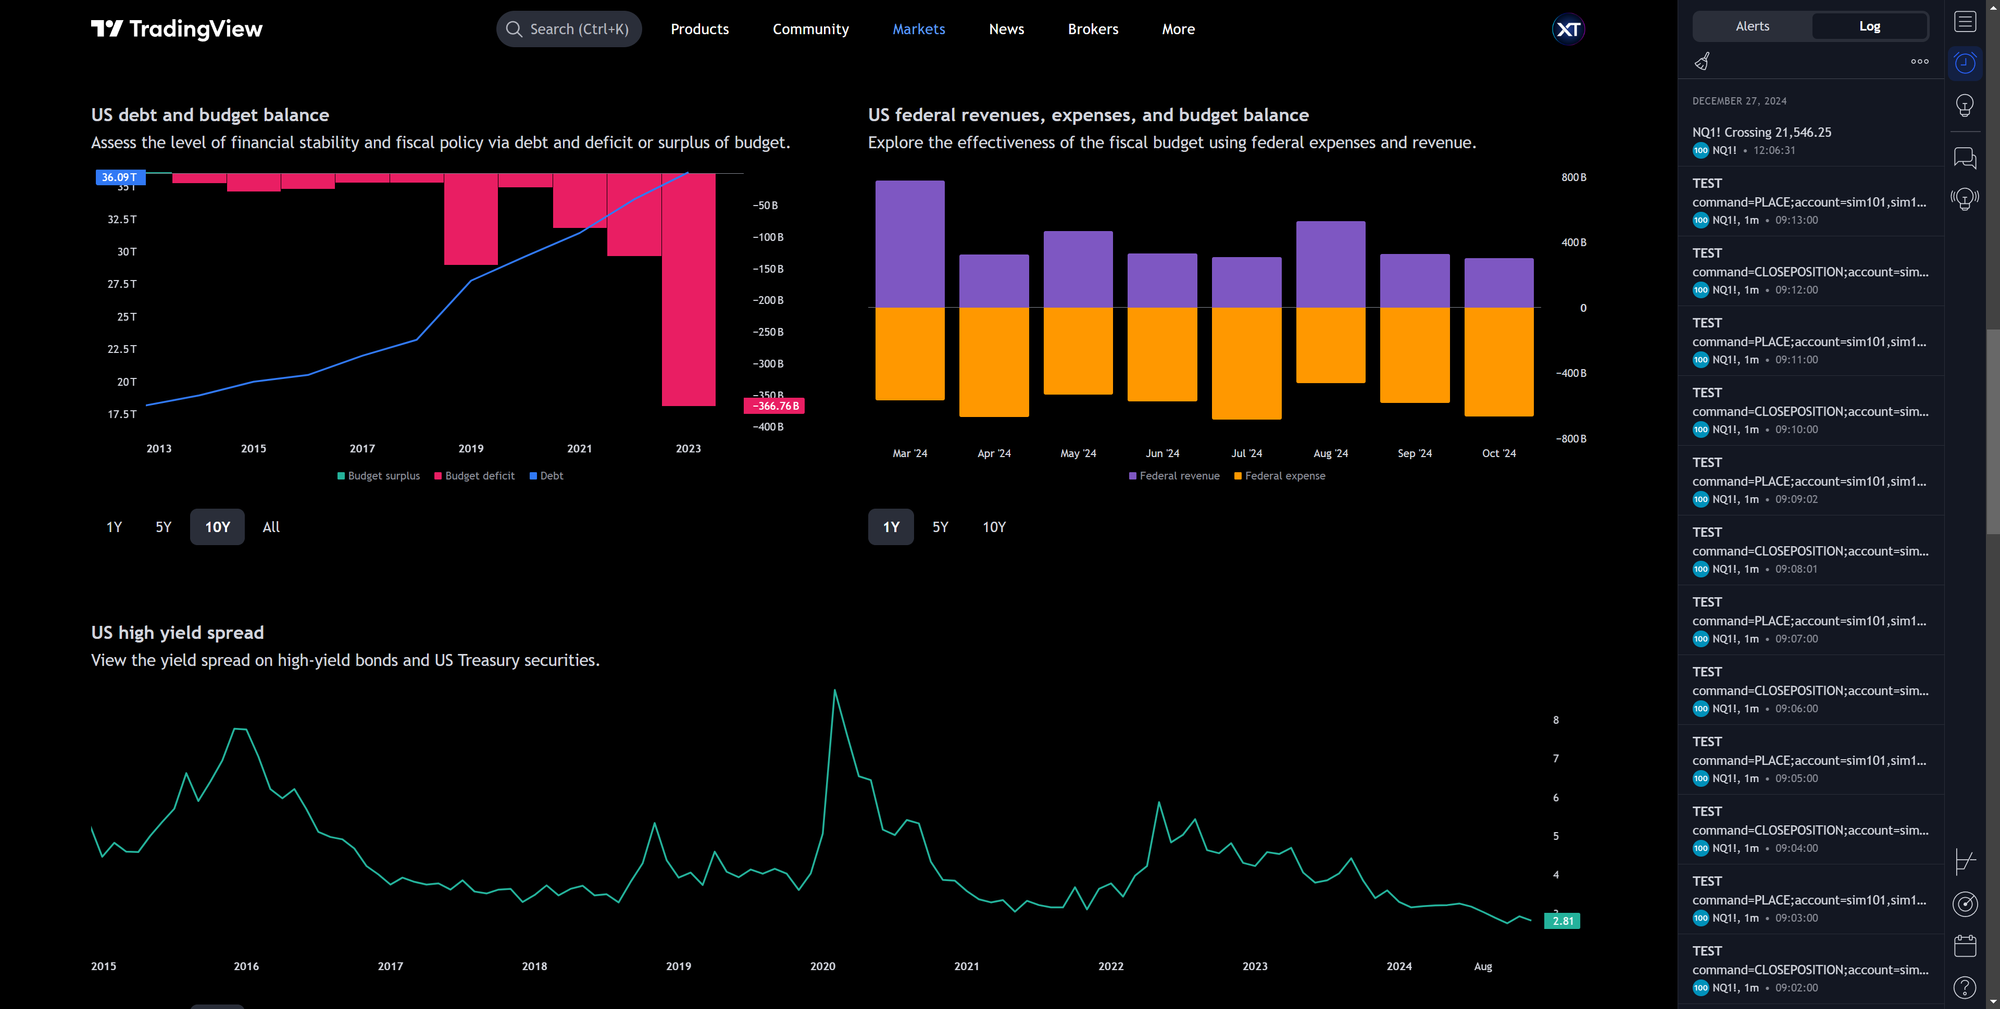
Debt Metrics
Analyze the debt levels of leading economies and their implications for market stability.
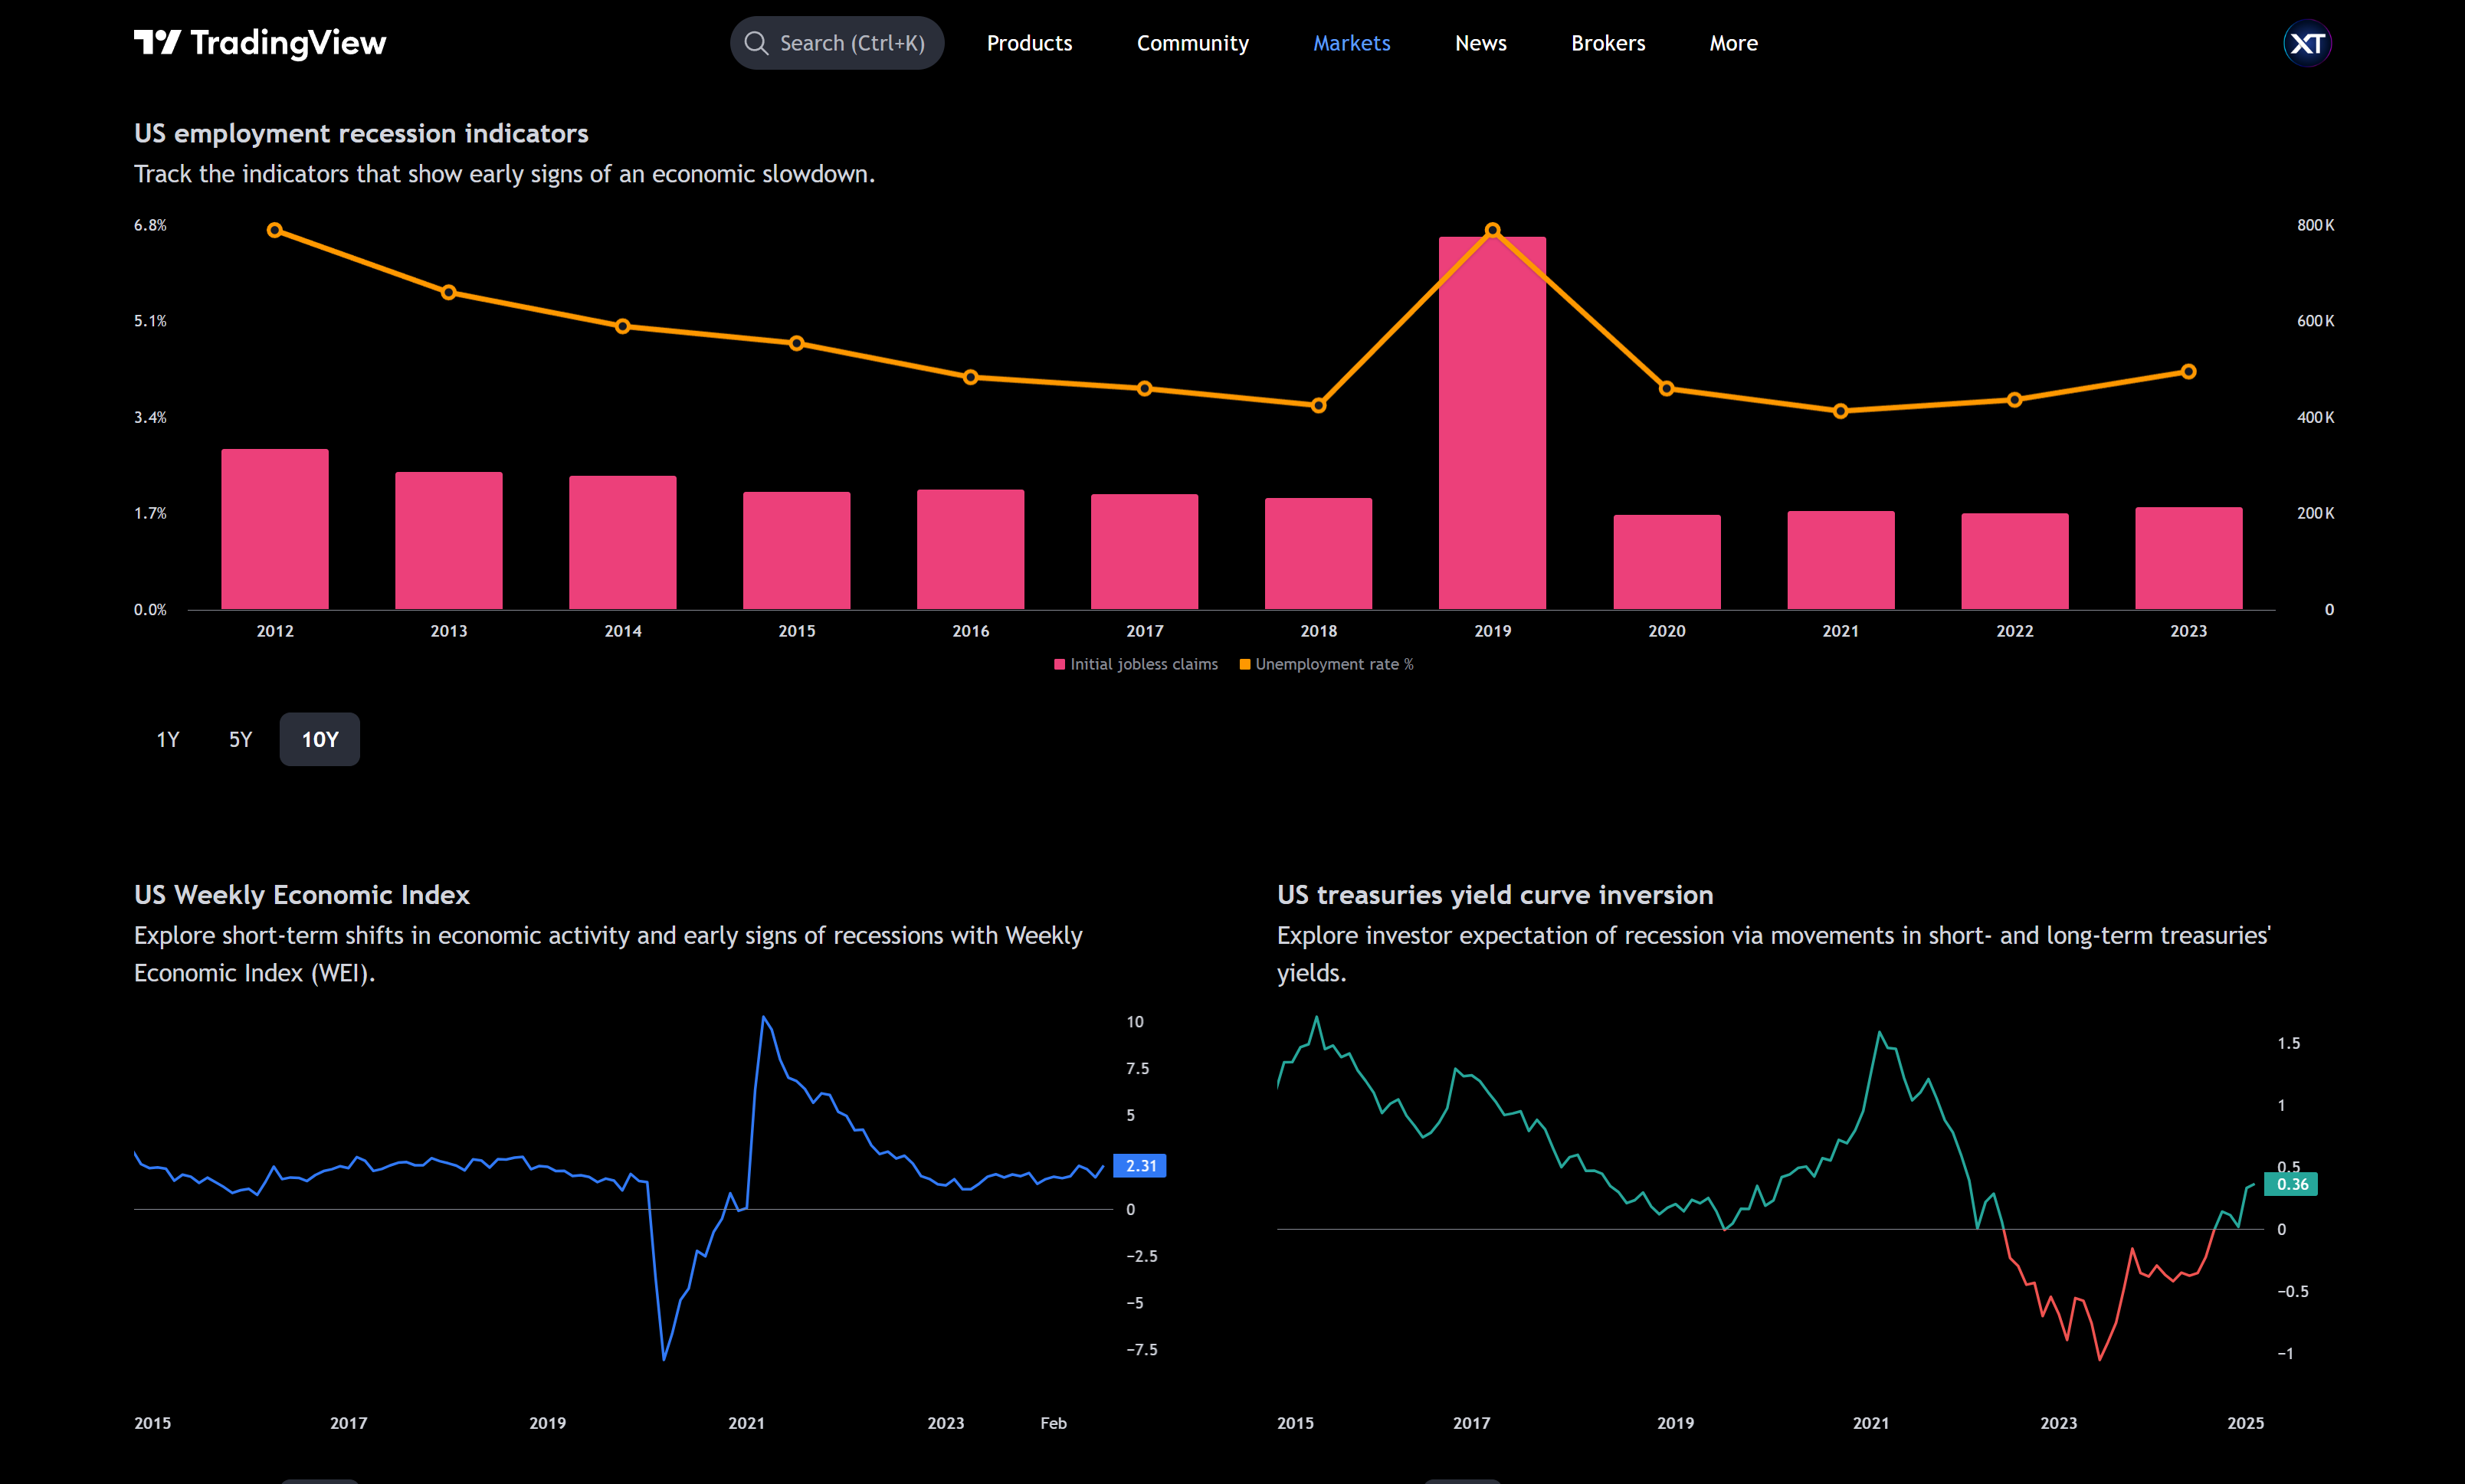
Economic Growth Indicators
Dive into GDP growth data and recession signals to assess the health of key economies.
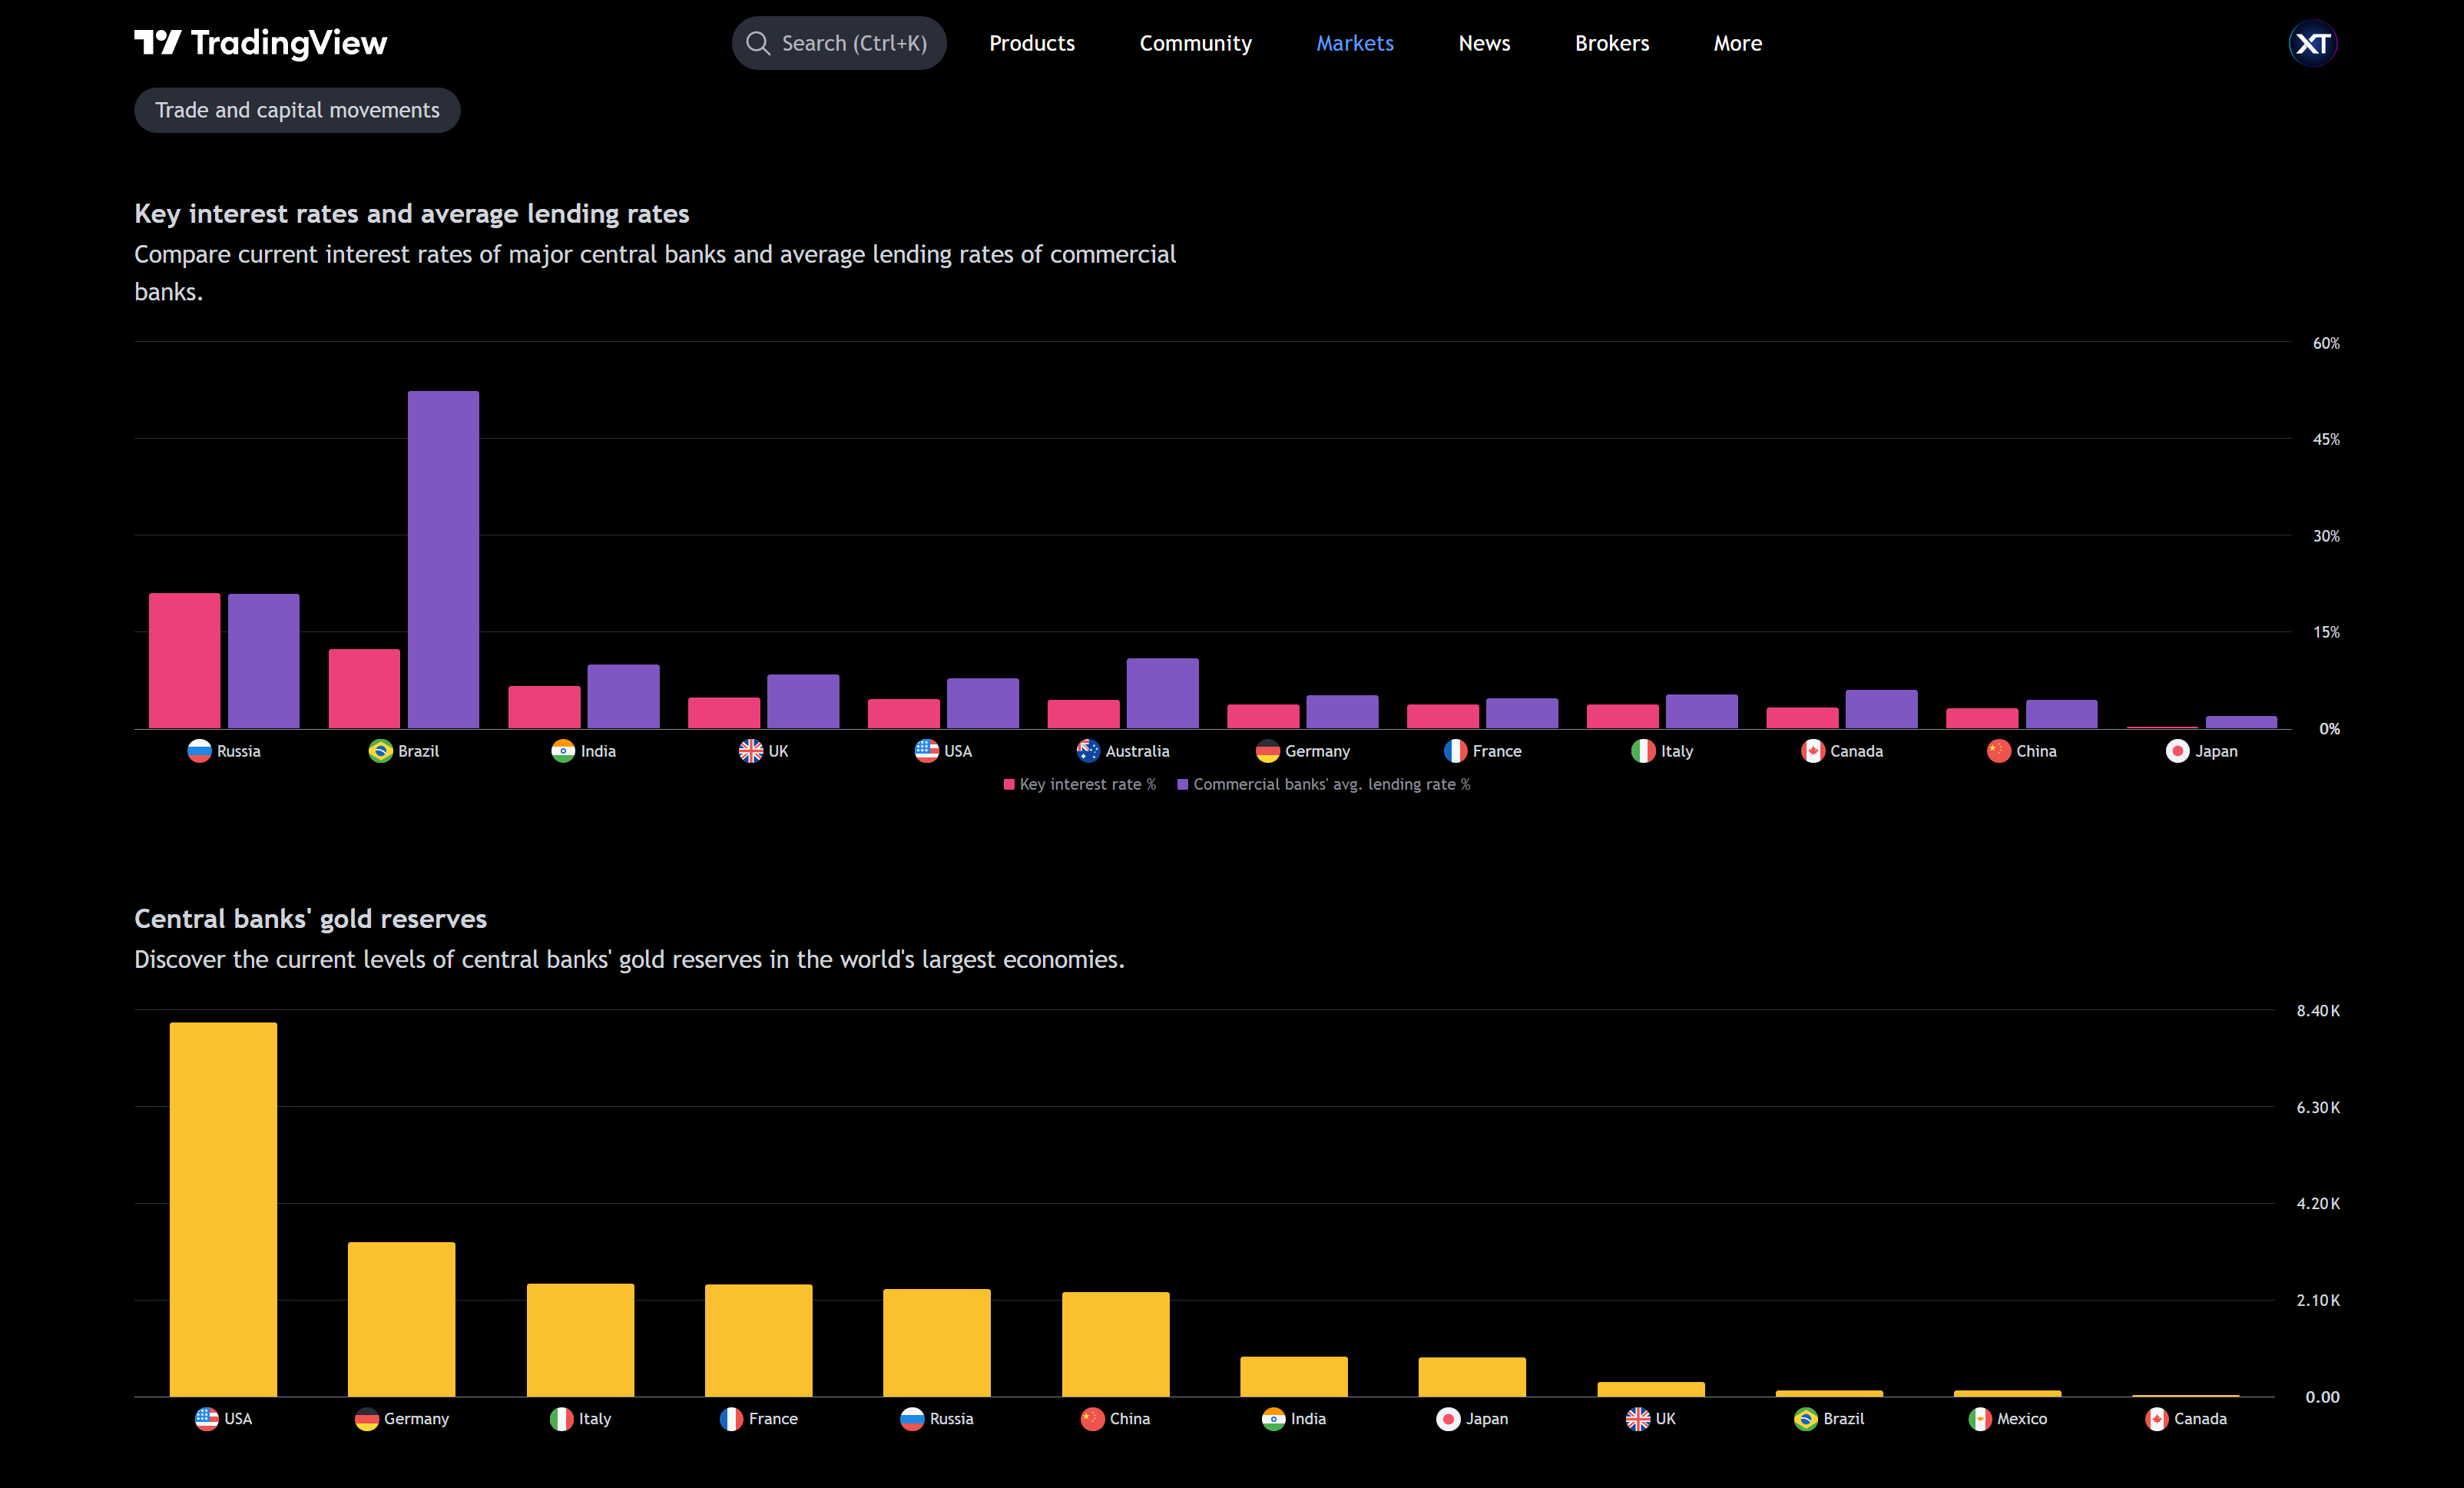
Banking and Financial System Data
Access details on central bank rates, gold reserves, and other vital financial metrics.
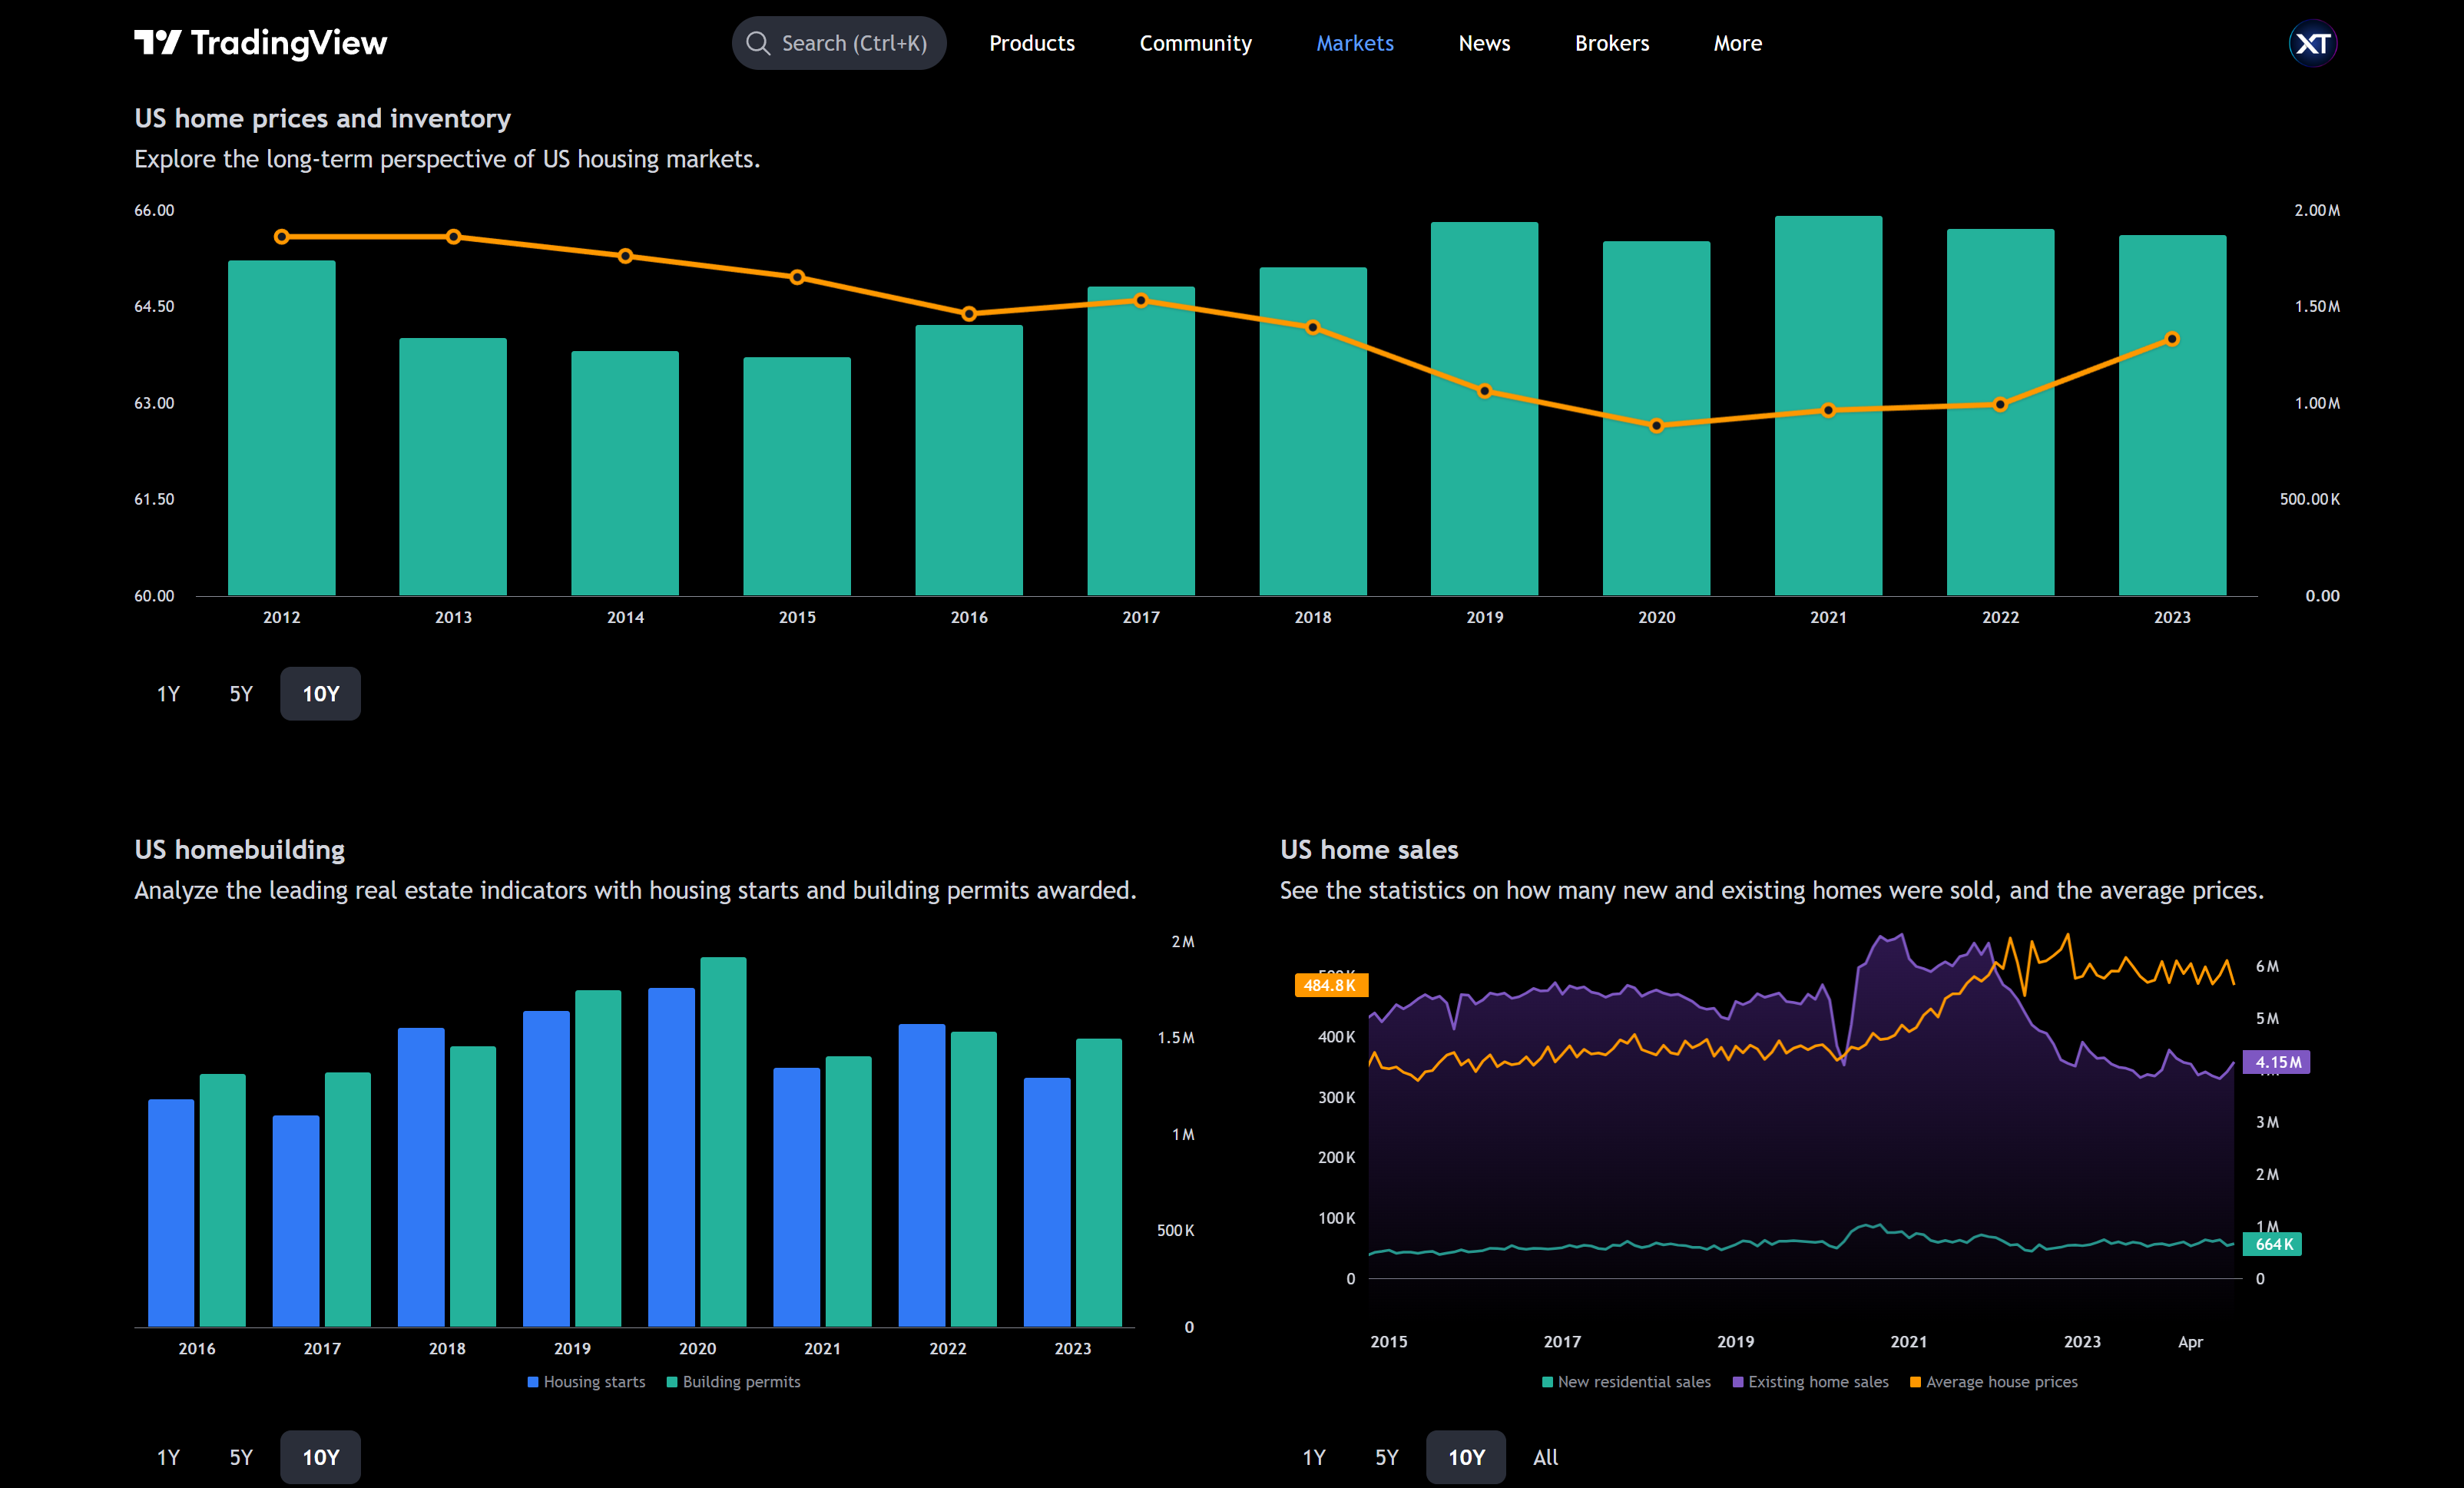
US Housing and Real Estate Analytics
Gain insights into the US housing market with charts on mortgage rates, home prices, and sales trends.
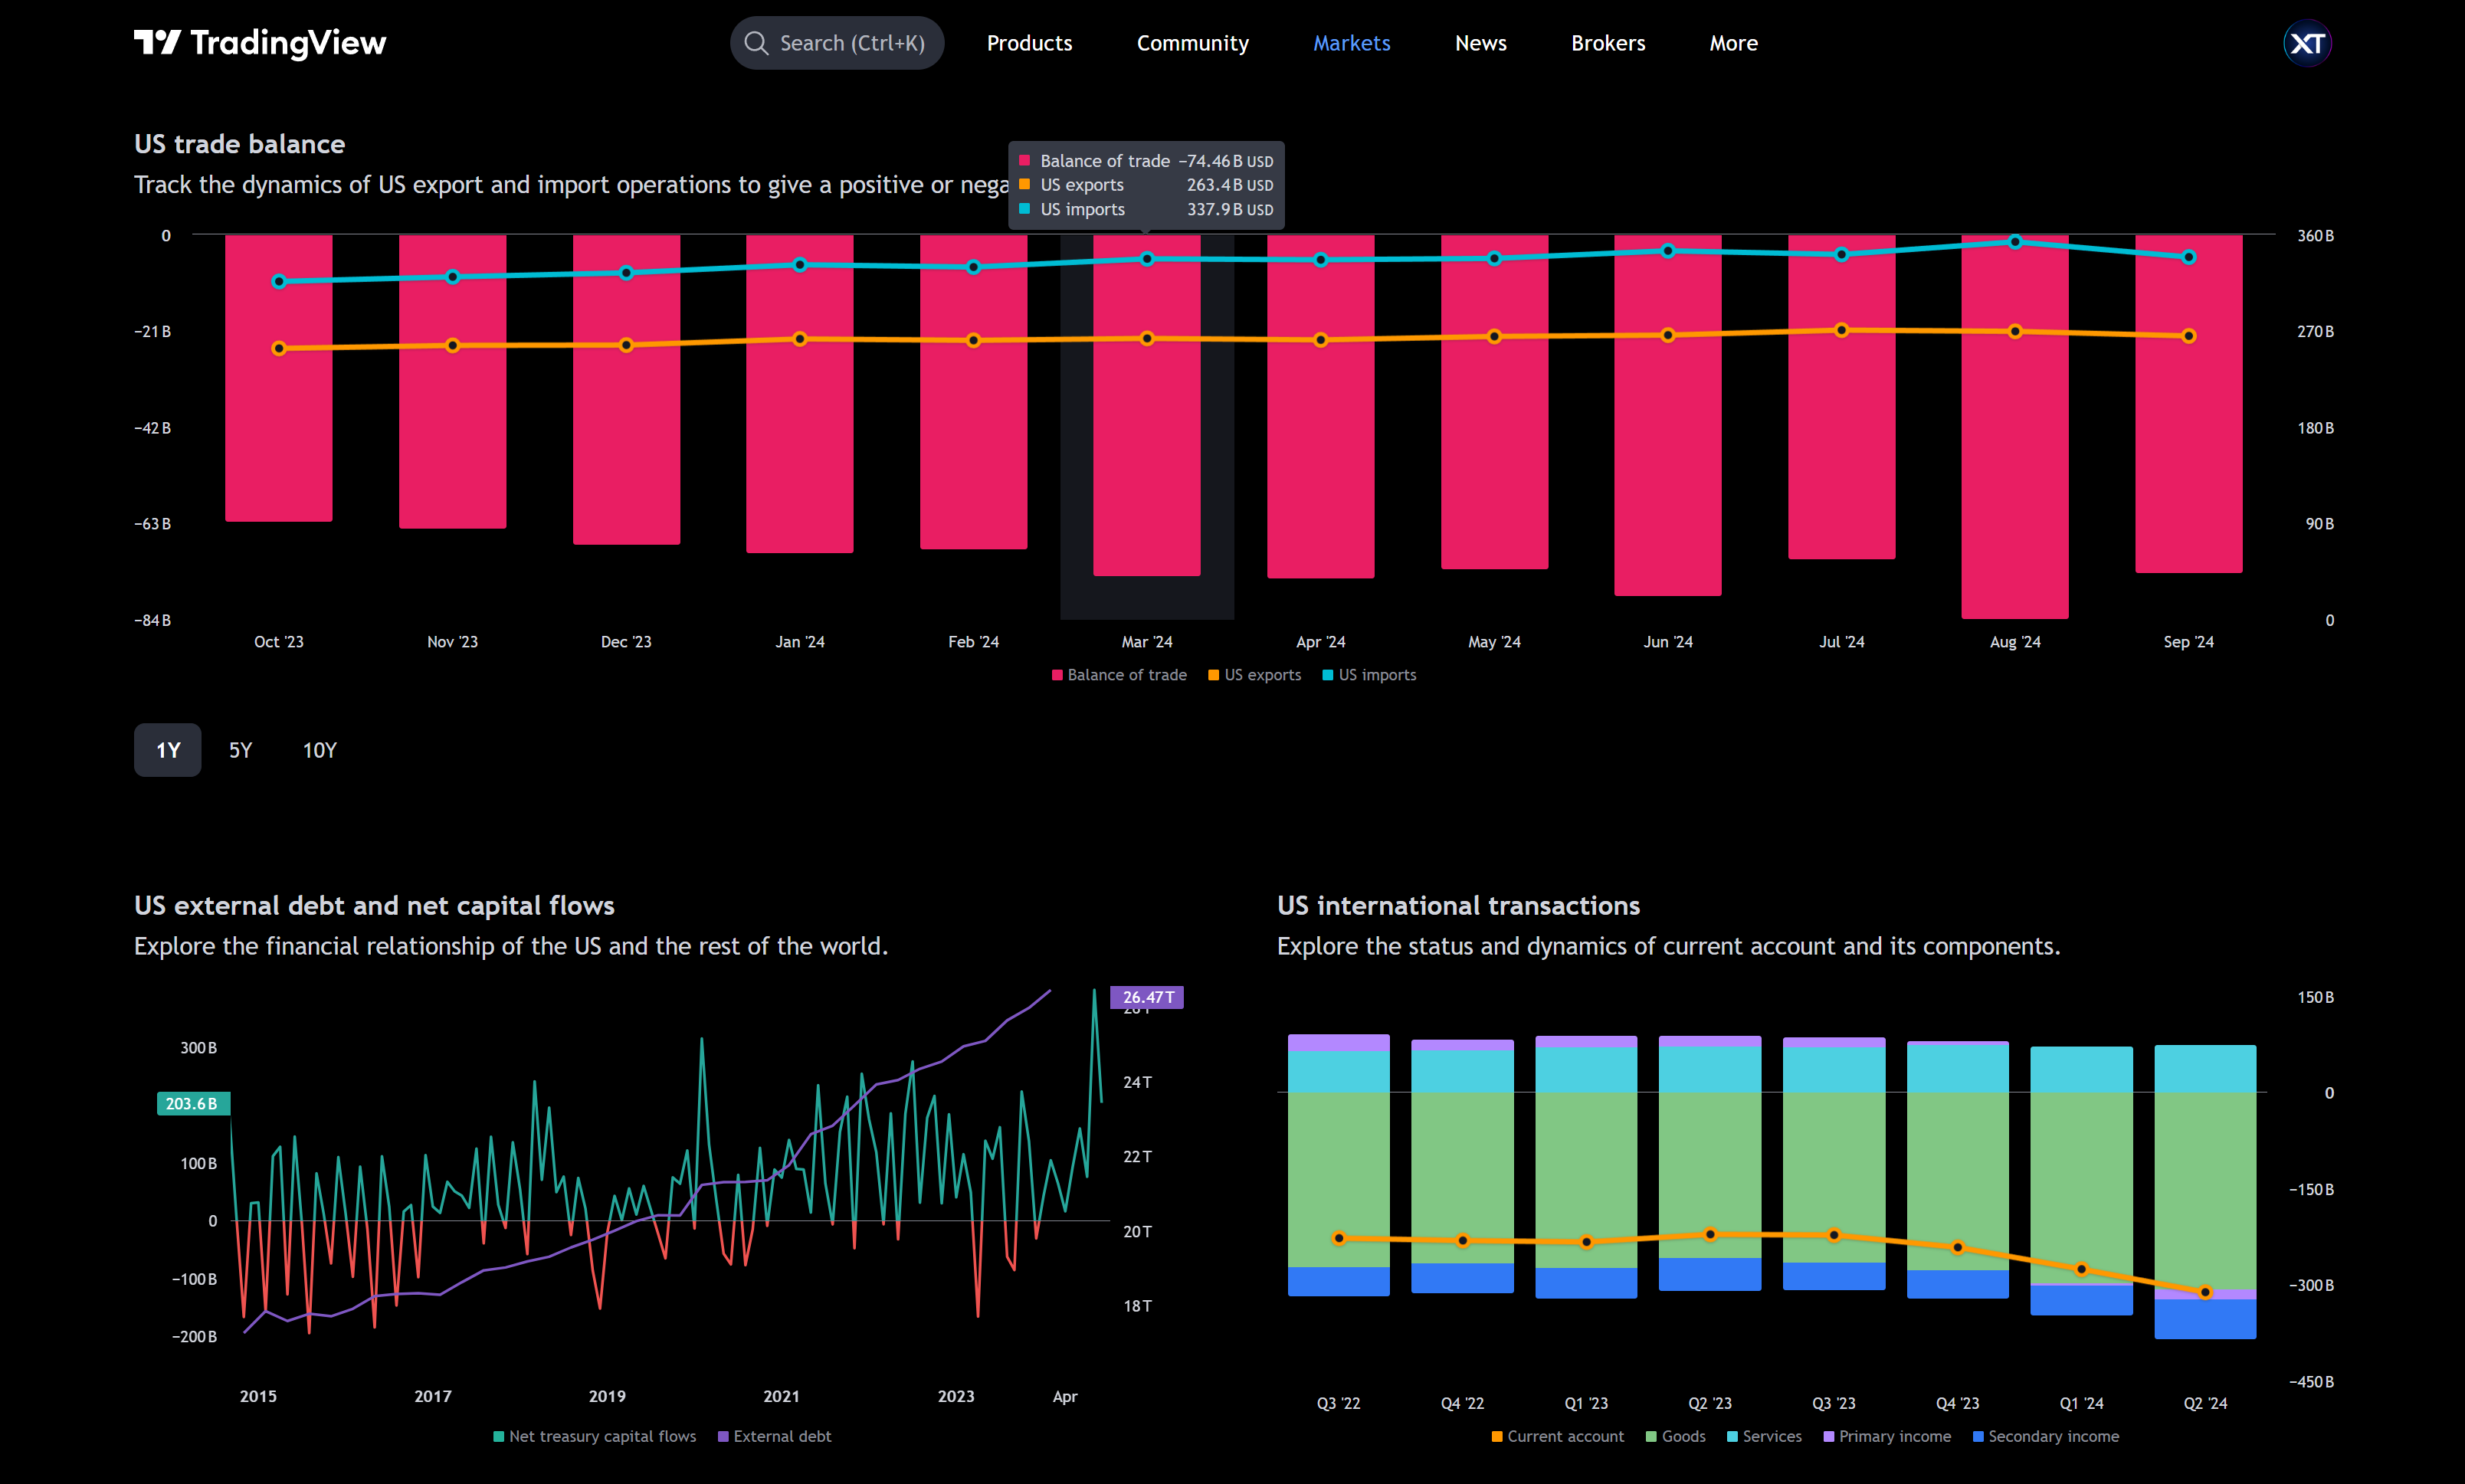
Trade and Capital Movements
Understand the US trade balance and capital flow dynamics for strategic planning.
Why This Matters
For CrossTrade users, tools like these are a game-changer. TradingView’s Economic Charts bring clarity to complex data, providing a global perspective that can sharpen your trading strategies. Whether you’re looking to compare inflation rates, assess GDP growth, or study consumer behavior, these visuals allow you to make more informed decisions with confidence.
Get Started
TradingView’s Economic Charts are a valuable resource for anyone serious about staying ahead in today’s fast-moving markets. At CrossTrade, we’re committed to keeping you informed about tools like this to help you succeed.
Check out TradingView’s latest feature today, and let us know how it enhances your trading strategies!
Are you interested in sending your TradingView signals to NinjaTrader for automated trading?
