CrossTrade Logo
PricingHow It Works
Resources
download icon
Download XT
Download the CrossTrade NinjaTrader 8 Add-On
active account management icon
NT Account Manager
Control your NT8 daytrading account
CrossTrade Blog
Stay up to date on news and important updates
Help Docs
Comprehensive help documentation in one spot
CrossTrade VPS
Save 30% on a NinjaTrader VPS through CrossTrade
XT Alert Builder
Our free TradingView strategy for alert building
candlestick chart icon
TradingView Indicators
Download our free TradingView indicators
Trading Journal
Organize your trading business with TraderSync
Prop Funding
Explore popular funding programs that offer NinjaTrader
computer chart icon
TradingView
Learn why TradingView is the worlds most popular charting platform
ninjatrader brokerage world icon
NinjaTrader
Learn why NinjaTrader is the leader in the Futures Industry
contact us icon
Contact Us
Have a question for the team? Ask away!
discord server community icon
Help DocsFree IndicatorsTradingViewNinjaTraderAffiliatesContact Us
Sign UpLog InDashboard
Indicators
Supertrend

Double SuperTrend Indicator

Download

By downloading this indicator you agree to the terms in our Trading Disclaimer

Image of the Double SuperTrend TradingView Indicator

Overview of SuperTrend

The SuperTrend indicator is a popular technical analysis tool used in financial markets to identify the direction of the price trend. It was developed by Olivier Seban, a French author and self-taught trader. The exact date of its creation is not widely documented, but it gained significant popularity among traders in the early 21st century.

The primary purpose of the SuperTrend indicator is to indicate the prevailing trend in the price of an asset and to provide potential entry and exit points. It does this by plotting a line on a chart which follows the current trend. This line is typically colored differently depending on whether the trend is upward (often green) or downward (often red). The SuperTrend combines aspects of trend analysis and volatility, as it uses the Average True Range (ATR) in its calculation, adjusting its sensitivity with market volatility.

Strengths

Weaknesses

Simplicity and Clarity: One of the key advantages of the SuperTrend indicator is its simplicity. The clear visual representation of trend direction makes it easy to interpret, even for novice traders.

‍Versatility: It can be applied across various time frames and markets, including stocks, forex, and futures, making it versatile for different trading styles.

‍Effective in Trending Markets: The SuperTrend is particularly effective in strong trending markets, providing clear signals for entry and exits.

‍Risk Management: It can be used to set trailing stop losses, helping traders manage risk by potentially protecting profits and limiting losses.

Lagging Indicator: Being based on historical price data, the SuperTrend is a lagging indicator. This can lead to delayed signals in rapidly changing markets.
‍
‍False Signals in Sideways Markets: In markets with low volatility or when the price moves sideways (ranging markets), the SuperTrend can generate false or misleading signals.
‍
‍No Insights on Price Momentum: The SuperTrend does not provide information about the strength or momentum of the trend, which can be a significant limitation for some trading strategies.
‍
‍Over-reliance Risk: Traders might become over-reliant on this single indicator, ignoring other important market factors and analysis methods.

Solving weakness with Double SuperTrend

The Double SuperTrend indicator enhances the classic SuperTrend indicator's functionality by filtering out countertrend signals and keeping you out of chop. By adding another larger trend filter, it helps to keep you taking trades in the direction of the major trend. This dual analysis allows users to identify and trade in the direction of the major trend, thereby increasing the likelihood of successful trades.

Adjustable Parameters for Minor and Major Trends:
Users can customize both the major and minor trends according to their trading strategy. This includes adjusting the ATR (Average True Range) period and the ATR multiplier for each trend. For the minor trend, the default ATR period is set at 10, and the multiplier at 3.0. For the major trend, the ATR period defaults to 14, with a multiplier of 6.0. These settings allow traders to tailor the sensitivity of the trends to their specific market view or strategy.

Source Selection:

Users can select the data source (such as high/low, open/close) that the SuperTrend calculations are based on, offering further customization.

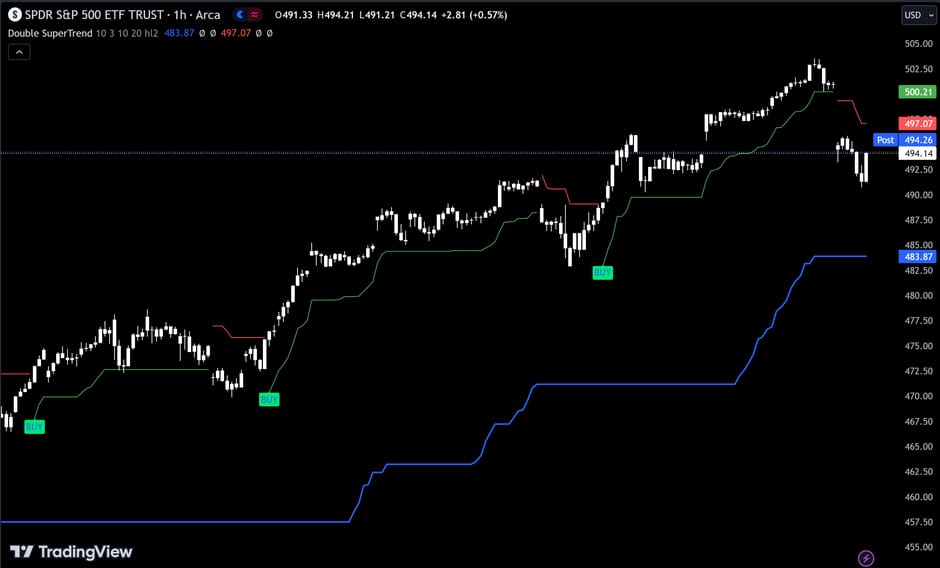
Signal Visualization and Customization: It plots the major and minor trend lines, with options to display buy/sell signals. These signals are only shown when they align with the major trend, reducing the likelihood of false signals. The minor trend signals are displayed in green (for uptrends) and red (for downtrends), while the major trend lines are shown in blue (for uptrends) and purple (for downtrends). Additionally, users can choose to display or hide these buy/sell signals.

TradingView Custom Alerts: The indicator includes the Pine Script functionality to set custom alerts for buy and sell signals. These alerts are specifically designed to notify users when a signal aligns with the confirmed major trend.

Check out another indicator...
VWAP Trend
CrossTrade Logo
AriseHealth logoOE logo2020INC logofacebook iconEphicient logoThe Paak logo
Company
BlogPricingCareersAbout UsContact UsAffiliate Program
Resources
DownloadHelp DocsIndicatorsNinjaTraderTradingViewXT Alert Builder
Legal
Privacy PolicyRefund PolicyReferral ProgramTerms of ServiceTrading DisclaimerManage Preferences
CrossTrade facilitates the linkage between alert information sent from a user's chosen trading platform (TradingView) to their selected brokerage or exchange account (NinjaTrader). It is important to note that CrossTrade itself does not generate alerts or offer any trading advice whatsoever. The purpose of the CrossTrade platform is purely to aid traders and investors in implementing their own trading strategies based on their personal alerts. We do not advocate for the purchase or sale of any securities. Additionally, we do not provide any form of trading or investment advice. The platform and its assortment of features, capabilities, and tools are offered on an 'as-is' basis, without any form of warranty. It is crucial to understand that trading any asset carries significant risk and may not be suitable for all individuals. Engage in trading or investing only with capital that you can afford to risk losing.​​

CFTC Rule 4.41 (Hypothetical Disclaimer) U.S. Government Required Disclaimer - Commodity Futures Trading Commission Futures and Options trading has large potential rewards, but also large potential risk. You must be aware of the risks and be willing to accept them in order to invest in the futures and options markets. Don't trade with money you can't afford to lose. This is neither a solicitation nor an offer to Buy/Sell futures, stocks or options on the same. No representation is being made that any account will or is likely to achieve profits or losses similar to those discussed on this web site. The past performance of any trading system or methodology is not necessarily indicative of future results.

CFTC RULE 4.41 - HYPOTHETICAL OR SIMULATED PERFORMANCE RESULTS HAVE CERTAIN LIMITATIONS. UNLIKE AN ACTUAL PERFORMANCE RECORD, SIMULATED RESULTS DO NOT REPRESENT ACTUAL TRADING. ALSO, SINCE THE TRADES HAVE NOT BEEN EXECUTED, THE RESULTS MAY HAVE UNDER-OR-OVER COMPENSATED FOR THE IMPACT, IF ANY, OF CERTAIN MARKET FACTORS, SUCH AS LACK OF LIQUIDITY. SIMULATED TRADING PROGRAMS IN GENERAL ARE ALSO SUBJECT TO THE FACT THAT THEY ARE DESIGNED WITH THE BENEFIT OF HINDSIGHT. NO REPRESENTATION IS BEING MADE THAT ANY ACCOUNT WILL OR IS LIKELY TO ACHIEVE PROFIT OR LOSSES SIMILAR TO THOSE SHOWN.

Testimonials featured on this website are individual experiences and personal opinions from our users. They are not representative of all reasonably comparable accounts and should not be viewed as guarantees of future performance or success. Any mention of profits or specific returns has been excluded to ensure compliance with regulatory guidelines. Testimonials do not use exaggerated or misleading language and are not indicative of typical results. If a testimonial is paid or incentivized, it will be clearly disclosed.

The following trade names are mentioned on this website to highlight the interoperability of the CrossTrade technology offering with their platforms. CrossTrade is not associated with or endorsed by any of these organizations.​

- TradingView and the TradingView logo are registered trademarks of TradingView, Inc. and/or MultiCharts LLC.
- NinjaTrader, NinjaTrader.com, and other associated NinjaTrader trademarks and names are registered trademarks and property of NinjaTrader Group, LLC., and/or NinjaTrader Clearing, LLC., and/or other NinjaTrader affiliates and entities.
‍
© 2025 CrossTrade LLC. All right reserved.