Free TradingView indicators built for CrossTrade
Open-source scripts with webhook-ready alerts baked in. Drop them on any TradingView chart and route signals to NinjaTrader 8 in around 30 milliseconds.
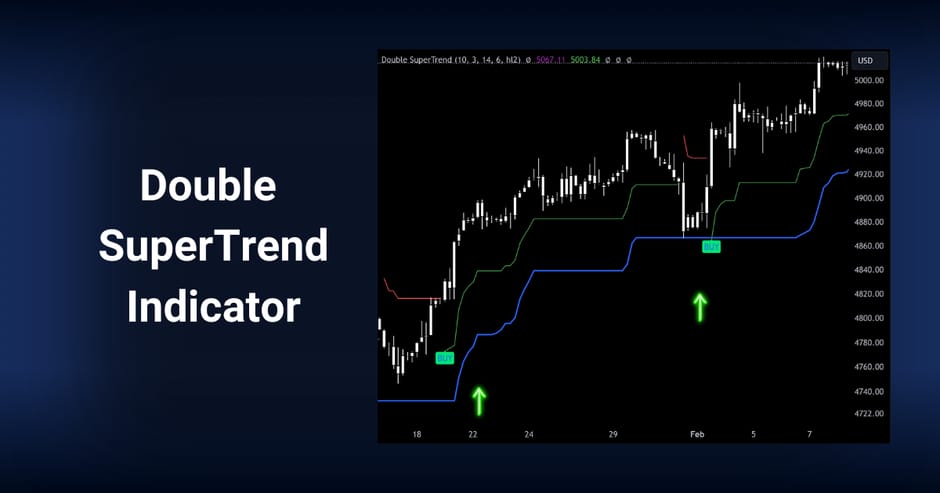
Double SuperTrend
Two SuperTrends stacked for cleaner trend confirmation and webhook-ready alerts.
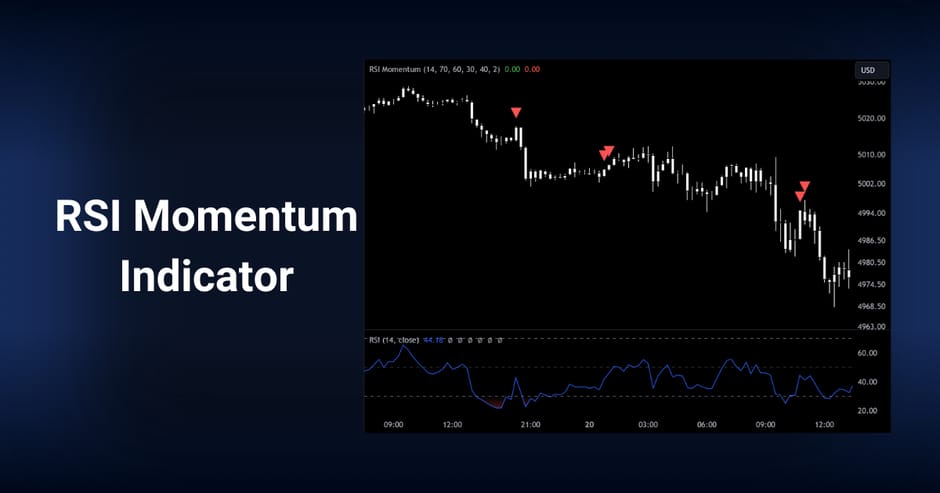
RSI Momentum
RSI continuation signals that follow the trend instead of trying to pick tops or bottoms.
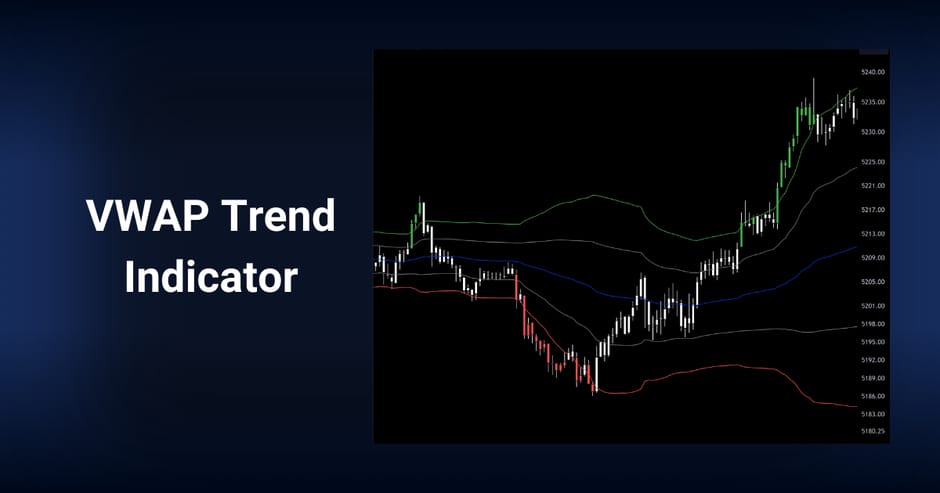
VWAP with Trend Alerts
Volume Weighted Average Price with deviation bands and trend-bar coloring for breakout alerts.
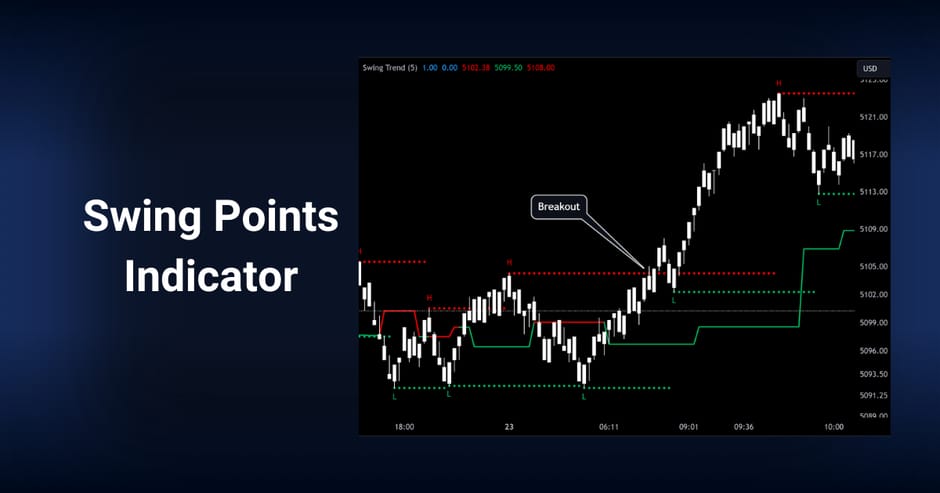
Swing Points
Auto-detected swing highs and lows with a dynamic center line for trend bias and S/R.
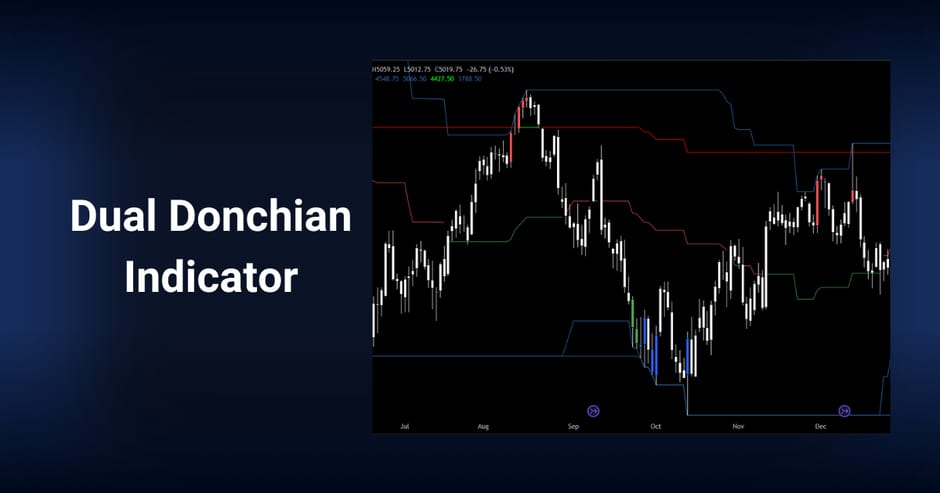
Double Donchian Channels
Inner and outer channels for trend context, breakout confirmation, and pullback identification.
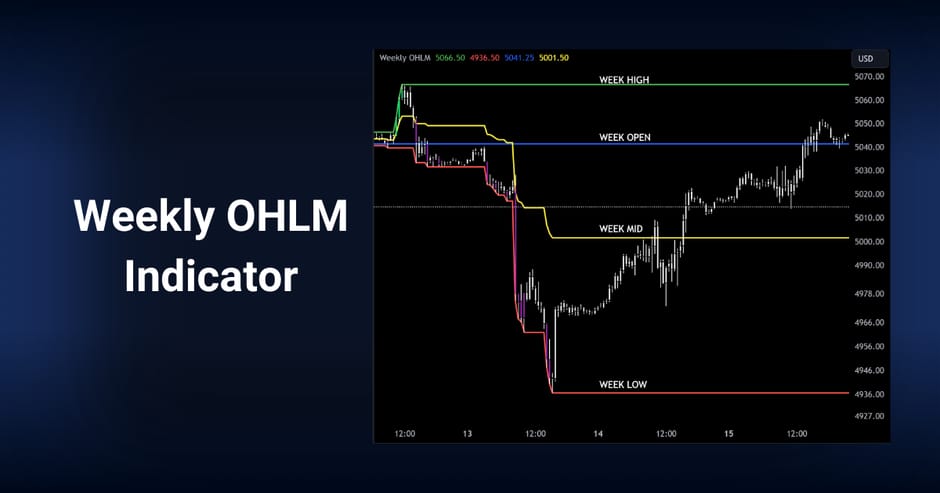
Weekly OHLM
Weekly open, high, low, and midpoint levels with cross alerts for context plays.
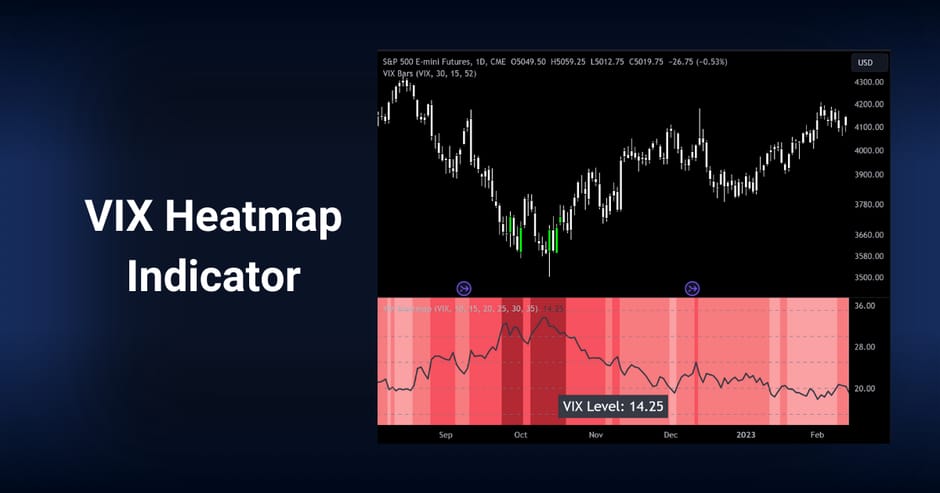
VIX Heatmap
Background heatmap that shifts color intensity as volatility rises across configurable thresholds.
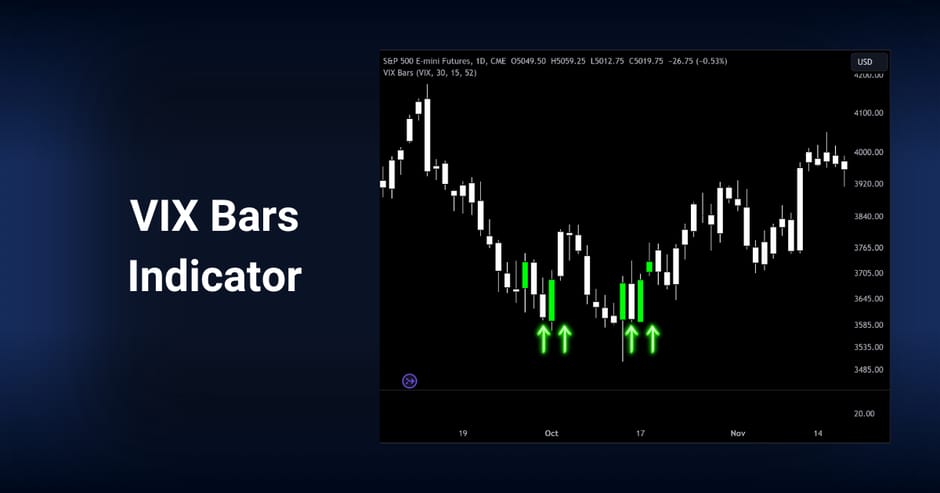
VIX Bars
Color your bars at VIX extremes to flag potential turning points based on volatility.
XT Alert Builder (Free)
Build CrossTrade webhook alerts visually, then drop them on any chart.
True OHLC
See the real OHLC values on Heikin Ashi charts as alert-ready overlay sources.
Time-based Alert
Fire alerts at specific times of day. Useful for flatten-on-time or scheduled actions.
Up Bar / Down Bar
Minimal example indicator. Read this first to learn how alert messages are structured.
Basic MA Crossover
Bare-bones strategy template you can fork and customize for any moving-average pair.
MA Crossover with SL / TP
Same strategy with 50-tick stops and targets passed through the alert message variable.
Dynamic Position Sizing
MA crossover with position size computed from equity percent or fixed dollar amount.
Breakeven and Multi Targets
Independent alerts for entry, breakeven, and three configurable profit targets.
ATR Based SL / TP
Volatility-adaptive stop and target placement using the Average True Range.
XT Alert Builder and the Pro indicator suite
Subscribers get invite-only access to the XT Alert Builder family, the Strategy Builder backtest harness, and other premium scripts. Visual configuration of the full CrossTrade payload with no JSON, no docs trawling.
Automate any of these with CrossTrade
Each indicator above ships with webhook-ready alert conditions. Connect a TradingView alert to your CrossTrade account and route signals to NinjaTrader 8 in around 30 milliseconds.
Start Free 7-Day Trial