RSI Momentum Indicator
By downloading this indicator you agree to the terms in our Trading Disclaimer
Overview of the RSI (Relative Strength Indicator)
The Relative Strength Index (RSI) is a popular momentum oscillator used in technical analysis to measure the speed and change of price movements. It was developed by J. Welles Wilder Jr. and introduced in his book "New Concepts in Technical Trading Systems" in 1978.
Strengths
Weaknesses
Identifying Overbought/Oversold Conditions: RSI is effective in identifying potential reversal points in the market.
Divergence: RSI can be used to identify divergence between price and momentum, which may signal a potential trend reversal.
Simple Interpretation: Its straightforward interpretation makes it accessible to both novice and experienced traders.
False Signals: Like many indicators, RSI can generate false signals, especially in strongly trending markets.
Lagging Indicator: RSI is a lagging indicator, meaning it may not provide timely signals during fast-moving market conditions.
Not Suitable for All Market Conditions: In strongly trending markets, RSI may remain in overbought or oversold territory for extended periods, leading to missed opportunities or false signals.
Solving weakness with RSI Momentum
The most common mistake trader make when using oscillators like the RSI is they attempt to trade in the counter trend direction of the overbought or oversold signals. This is more commonly known as trying to 'pick tops or bottoms' and highlights the primary weakness of using oscillators for signal generation--false signals.
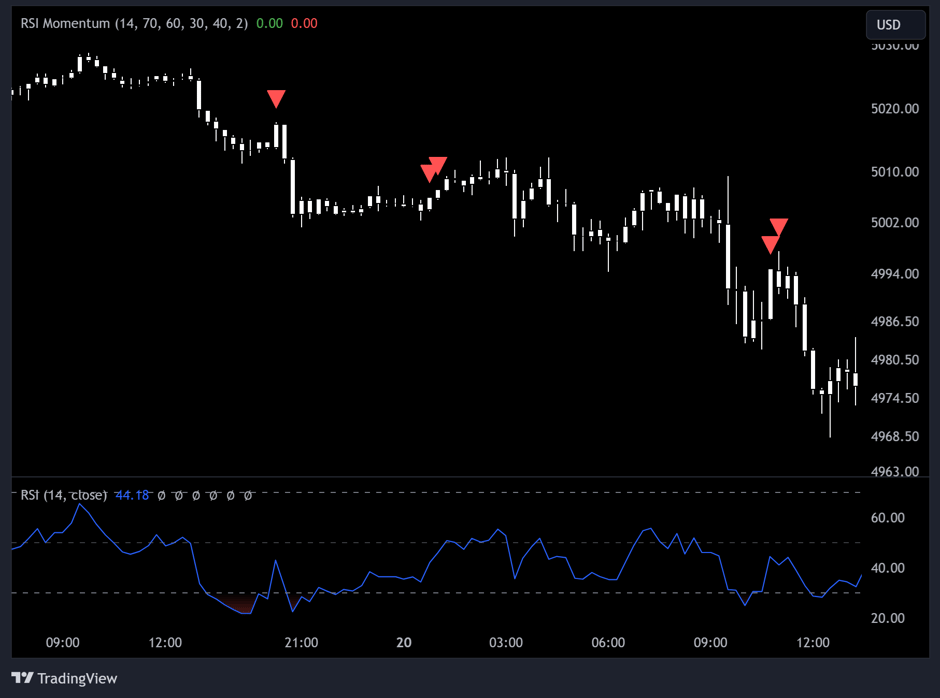
Our custom Pine Script RSI Momentum indicator takes a different approach, and instead of selling when overbought or buying when oversold, it simply waits for the indicator to retrace and then produces an alert in the direction of the same trend. This prevents the destructive behavior of getting on the wrong side of the trend and instead, looks to take advantage of the strength that pushed the RSI to the Overbought or Oversold thresholds.
Like all of our TradingView Indicators, the RSI Momentum indicator comes with individual alerts to be fully compatible with CrossTrade and automating your signals.