TRADING JOURNAL
CrossTrade Exclusive: Save 15% with code: CROSSTRADE
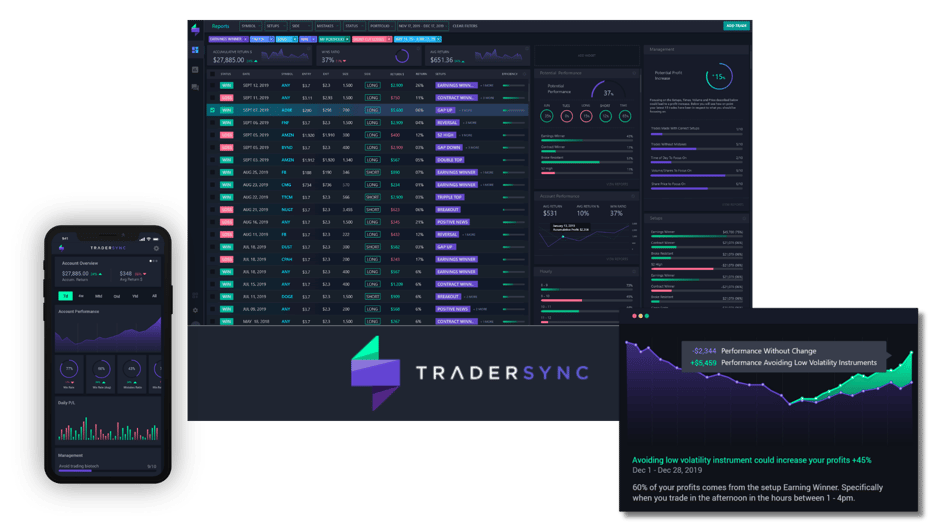
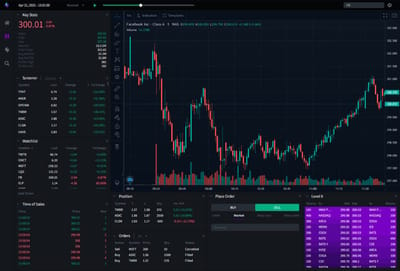
Interactive Charting & Visual Tools
Trade Charting: Track entries, exits, targets, and stop losses with interactive charts.
Intraday Charting: Analyze price action minute by minute.
Screenshot Uploads: Attach screenshots of your trades to recall decision-making moments.
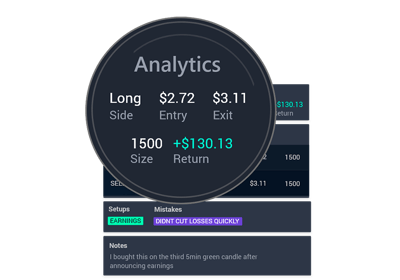
Advanced Analytics & Reporting
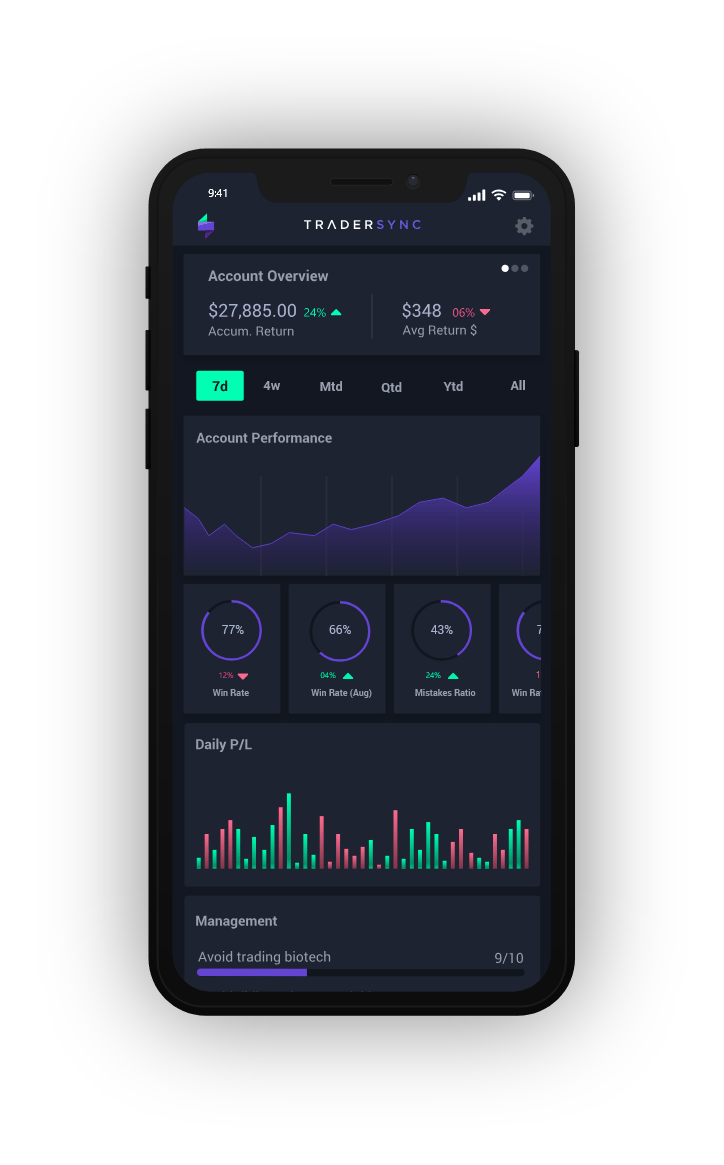
Trade-Specific Analytics: Automatically calculate return per share, overall return, and risk metrics.
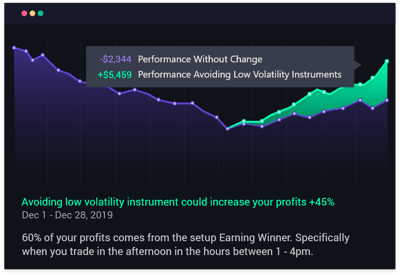
AI Feedback: Identify patterns in your trading data with AI-driven insights.
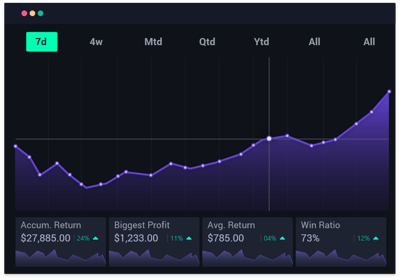
Performance Reporting: Compare setups and analyze performance across 10+ customizable reports.
Calendar Reporting: Track daily profitability.
Customization & Sharing Options
Custom Data Sharing: Share selected trade data with mentors or peers, excluding sensitive details as needed.
Public Profiles: Showcase overall performance within the trading community.
Dashboard Widgets: Personalize your dashboard with 20+ widgets.
Simulation & Risk Management
Strategy Simulation: Test new trading strategies using historical data.
Real-Time Stats: Access real-time performance indicators to predict potential success before trades.
Risk Tracking: Monitor stop losses to ensure adherence to risk rules.
Interactive Charting & Visual Tools
Trade Charting: Track entries, exits, targets, and stop losses with interactive charts.
Intraday Charting: Analyze price action minute by minute.
Screenshot Uploads: Attach screenshots of your trades to recall decision-making moments.
Ease of Use & Accessibility
Multi-Device Support: Fully optimized for seamless use across devices.
Data Import/Export: Import years of trade history or manually enter trades with ease.
Worldwide Market Support: Accessible for most markets, with trade charting focused on U.S. equities.
If you’re serious about improving as a trader, a high-quality trading journal is a must-have tool. TraderSync takes journaling to the next level with automation, AI-powered insights, and detailed analytics—all tailored to help you trade smarter. Take advantage of this exclusive CrossTrade discount and start tracking your trades more effectively today!