CrossTrade Logo
PricingHow It Works
Resources
download icon
Download XT
Download the CrossTrade NinjaTrader 8 Add-On
active account management icon
NT Account Manager
Control your NT8 daytrading account
CrossTrade Blog
Stay up to date on news and important updates
Help Docs
Comprehensive help documentation in one spot
CrossTrade VPS
Save 30% on a NinjaTrader VPS through CrossTrade
XT Alert Builder
Our free TradingView strategy for alert building
candlestick chart icon
TradingView Indicators
Download our free TradingView indicators
Trading Journal
Organize your trading business with TraderSync
Prop Funding
Explore popular funding programs that offer NinjaTrader
computer chart icon
TradingView
Learn why TradingView is the worlds most popular charting platform
ninjatrader brokerage world icon
NinjaTrader
Learn why NinjaTrader is the leader in the Futures Industry
contact us icon
Contact Us
Have a question for the team? Ask away!
discord server community icon
Help DocsFree IndicatorsTradingViewNinjaTraderAffiliatesContact Us
Sign UpLog InDashboard
Indicators
VIX Heatmap

VIX Heatmap Indicator

Download

By downloading this indicator you agree to the terms in our Trading Disclaimer

Image of the VIX Heatmap indicator on a TradingView Chart

Overview of VIX

The VIX tracks the expected volatility in the stock market over the next 30 days. It's based on options prices of the S&P 500 Index, which is a broad representation of the U.S. stock market. In simple terms, when traders expect bigger swings (up or down) in the market, the VIX goes up. When they expect calmer market conditions, the VIX goes down. A high VIX reading usually means a higher level of fear or uncertainty in the market, often seen during times of financial turmoil. A low VIX suggests confidence or complacency among investors. It's crucial to remember that the VIX isn't a predictor of market direction. It doesn't tell you which way the market will move, just how volatile it might be.

How the VIX Heatmap works

The "VIX-Heatmap" is a sophisticated and informative custom Pine Script indicator designed for traders who want to integrate volatility analysis into their trading strategy, especially focusing on the market's fear gauge, the VIX (Volatility Index). This tool is not just about plotting numbers; it's about visualizing market sentiment in a more intuitive and impactful way.

Key Features and Customization Options:
‍
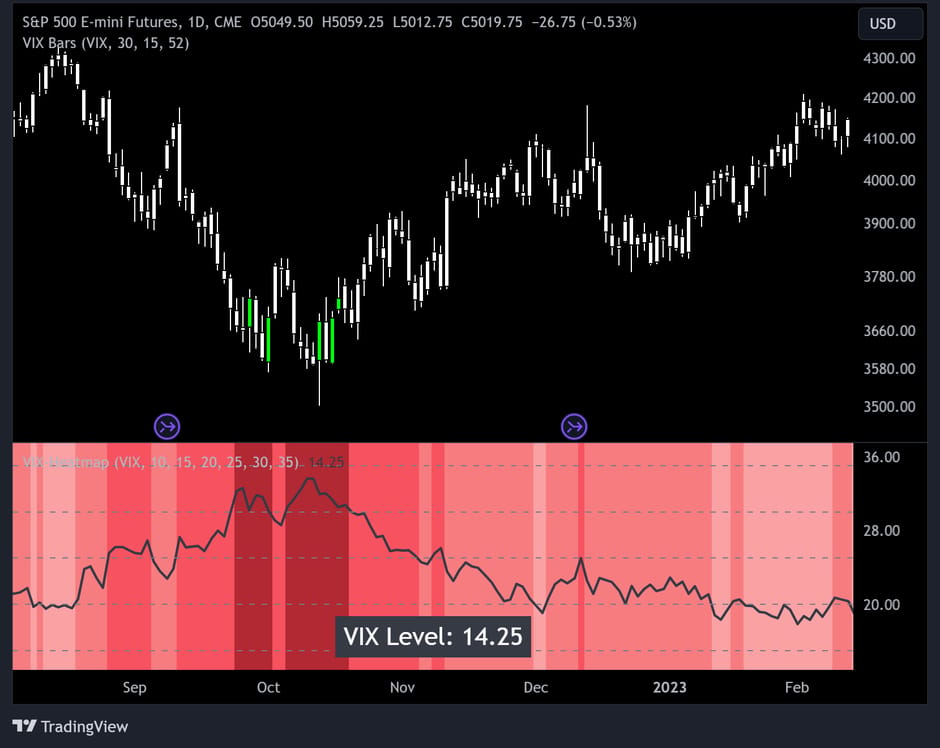
1. Primary Functionality: At its core, the VIX-Heatmap tracks the daily closing price of the VIX. It provides a clear, line-based visualization, with the line color set to black for stark contrast and easy visibility.
‍
2. Segmented Volatility Levels: The indicator allows users to set multiple VIX levels: Danger Zone (super low VIX level), and Levels 1 through 5. These levels are represented as horizontal lines on the chart, offering a structured view of different volatility thresholds.

3. Customizable Thresholds: Traders can input their preferred values for each level, tailoring the indicator to fit their perception of market risk and volatility. This customization makes the tool versatile for different trading styles and market conditions.
‍
4. Heatmap Visualization: The chart's background color changes based on the VIX level, creating a "heatmap" effect. This visual representation allows traders to quickly gauge the current market sentiment. The color intensity varies from white (for extremely low VIX values) through various shades of red, increasing in intensity with higher VIX levels. This gradient provides an immediate visual cue of rising or falling market anxiety.

5. Interactive Display: The indicator includes an interactive table display at the bottom center of the chart that shows the current VIX level in large, bold text, ensuring that it catches the trader's eye.

6. Optional Background Coloring: Users have the option to enable or disable the heatmap feature. When enabled, the chart's background reflects the VIX level with the corresponding color, enhancing the visual impact of the data.

Applications and Benefits:

The VIX-Heatmap is ideal for traders who base their decisions not only on price movements but also on market sentiment and volatility. Its color-coded heatmap approach simplifies the interpretation of the VIX data, making it accessible even to those who may not be deeply familiar with volatility indices. By offering a quick visual summary of current market fear levels, it aids in making informed decisions, especially in times of market uncertainty.

In summary, the TradingView VIX-Heatmap indicator transforms the traditional VIX data into an interactive, visually engaging, and easy-to-interpret format.

Ready to automate your TradingView indicators? Check out the XT Alert Builder...
Let's Go!
CrossTrade Logo
AriseHealth logoOE logo2020INC logofacebook iconEphicient logoThe Paak logo
Company
BlogPricingCareersAbout UsContact UsAffiliate Program
Resources
DownloadHelp DocsIndicatorsNinjaTraderTradingViewXT Alert Builder
Legal
Privacy PolicyRefund PolicyReferral ProgramTerms of ServiceTrading DisclaimerManage Preferences
CrossTrade facilitates the linkage between alert information sent from a user's chosen trading platform (TradingView) to their selected brokerage or exchange account (NinjaTrader). It is important to note that CrossTrade itself does not generate alerts or offer any trading advice whatsoever. The purpose of the CrossTrade platform is purely to aid traders and investors in implementing their own trading strategies based on their personal alerts. We do not advocate for the purchase or sale of any securities. Additionally, we do not provide any form of trading or investment advice. The platform and its assortment of features, capabilities, and tools are offered on an 'as-is' basis, without any form of warranty. It is crucial to understand that trading any asset carries significant risk and may not be suitable for all individuals. Engage in trading or investing only with capital that you can afford to risk losing.​​

CFTC Rule 4.41 (Hypothetical Disclaimer) U.S. Government Required Disclaimer - Commodity Futures Trading Commission Futures and Options trading has large potential rewards, but also large potential risk. You must be aware of the risks and be willing to accept them in order to invest in the futures and options markets. Don't trade with money you can't afford to lose. This is neither a solicitation nor an offer to Buy/Sell futures, stocks or options on the same. No representation is being made that any account will or is likely to achieve profits or losses similar to those discussed on this web site. The past performance of any trading system or methodology is not necessarily indicative of future results.

CFTC RULE 4.41 - HYPOTHETICAL OR SIMULATED PERFORMANCE RESULTS HAVE CERTAIN LIMITATIONS. UNLIKE AN ACTUAL PERFORMANCE RECORD, SIMULATED RESULTS DO NOT REPRESENT ACTUAL TRADING. ALSO, SINCE THE TRADES HAVE NOT BEEN EXECUTED, THE RESULTS MAY HAVE UNDER-OR-OVER COMPENSATED FOR THE IMPACT, IF ANY, OF CERTAIN MARKET FACTORS, SUCH AS LACK OF LIQUIDITY. SIMULATED TRADING PROGRAMS IN GENERAL ARE ALSO SUBJECT TO THE FACT THAT THEY ARE DESIGNED WITH THE BENEFIT OF HINDSIGHT. NO REPRESENTATION IS BEING MADE THAT ANY ACCOUNT WILL OR IS LIKELY TO ACHIEVE PROFIT OR LOSSES SIMILAR TO THOSE SHOWN.

Testimonials featured on this website are individual experiences and personal opinions from our users. They are not representative of all reasonably comparable accounts and should not be viewed as guarantees of future performance or success. Any mention of profits or specific returns has been excluded to ensure compliance with regulatory guidelines. Testimonials do not use exaggerated or misleading language and are not indicative of typical results. If a testimonial is paid or incentivized, it will be clearly disclosed.

The following trade names are mentioned on this website to highlight the interoperability of the CrossTrade technology offering with their platforms. CrossTrade is not associated with or endorsed by any of these organizations.​

- TradingView and the TradingView logo are registered trademarks of TradingView, Inc. and/or MultiCharts LLC.
- NinjaTrader, NinjaTrader.com, and other associated NinjaTrader trademarks and names are registered trademarks and property of NinjaTrader Group, LLC., and/or NinjaTrader Clearing, LLC., and/or other NinjaTrader affiliates and entities.
‍
© 2025 CrossTrade LLC. All right reserved.