CrossTrade Logo
PricingHow It Works
Resources
download icon
Download XT
Download the CrossTrade NinjaTrader 8 Add-On
active account management icon
NT Account Manager
Control your NT8 daytrading account
CrossTrade Blog
Stay up to date on news and important updates
Help Docs
Comprehensive help documentation in one spot
CrossTrade VPS
Save 30% on a NinjaTrader VPS through CrossTrade
XT Alert Builder
Our free TradingView strategy for alert building
candlestick chart icon
TradingView Indicators
Download our free TradingView indicators
Trading Journal
Organize your trading business with TraderSync
Prop Funding
Explore popular funding programs that offer NinjaTrader
computer chart icon
TradingView
Learn why TradingView is the worlds most popular charting platform
ninjatrader brokerage world icon
NinjaTrader
Learn why NinjaTrader is the leader in the Futures Industry
contact us icon
Contact Us
Have a question for the team? Ask away!
discord server community icon
Help DocsFree IndicatorsTradingViewNinjaTraderAffiliatesContact Us
Sign UpLog InDashboard
Indicators
VIX Bars

VIX Bars Indicator

Download

By downloading this indicator you agree to the terms in our Trading Disclaimer

vix bars indicator chart image

Overview of VIX

The VIX tracks the expected volatility in the stock market over the next 30 days. It's based on options prices of the S&P 500 Index, which is a broad representation of the U.S. stock market. In simple terms, when traders expect bigger swings (up or down) in the market, the VIX goes up. When they expect calmer market conditions, the VIX goes down. A high VIX reading usually means a higher level of fear or uncertainty in the market, often seen during times of financial turmoil. A low VIX suggests confidence or complacency among investors. It's crucial to remember that the VIX isn't a predictor of market direction. It doesn't tell you which way the market will move, just how volatile it might be.

How the VIX Bars work

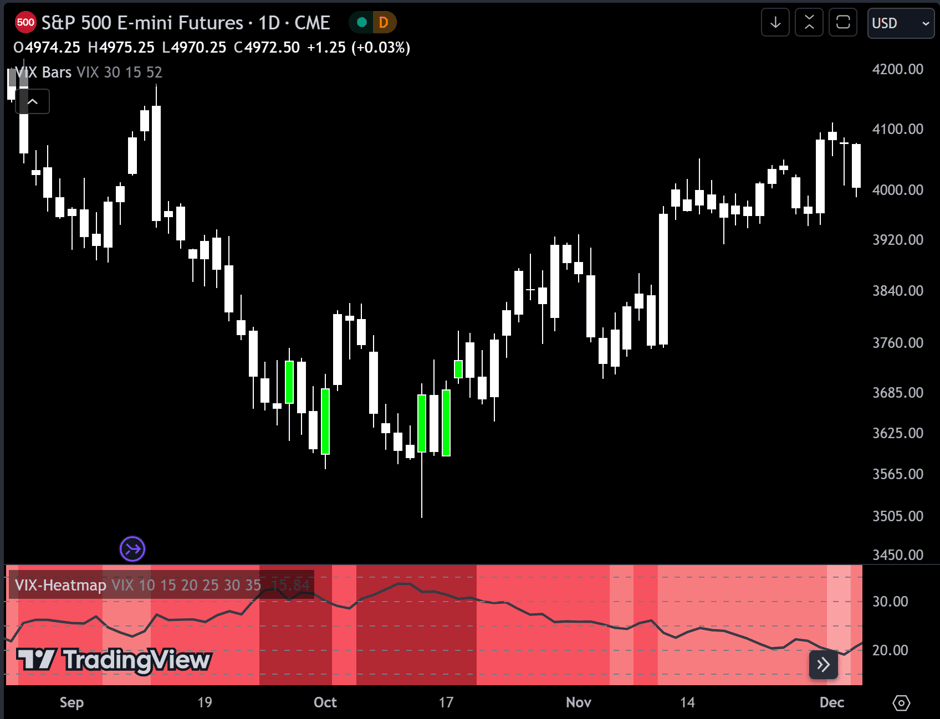
In simple terms, this custom Pine Script indicator colors your chart bars based on the VIX levels. We know that high volatility is unstainable and will naturally regress to a calmer market, therefore highlighting the bars where VIX is at extreme highs can sometimes indicate a market turning point.

‍Customizable VIX Levels: You can set your own thresholds for when the bars turn green or red. Green bars pop up when the VIX is above your set upper level (default is 30) - kind of like a heads-up that things might get bumpy. Red bars show up when the VIX dips below your lower threshold (default is 15), signaling calmer waters.

‍Optional Donchian Channel Filter: The Donchian Channel filter looks at the highest highs and lowest lows over your chosen period (default's 52 days) and only colors the bars if they match the filter's criteria. This adds an extra layer of confirmation that the colored bars at at a major high or low.

‍Visual Simplicity: The indicator keeps things visually straightforward. No cluttered screen, just colored bars telling you a story about market vibes. In essence, "VIX Bars" is like having a volatility radar on your chart. It doesn't make predictions, but it sure gives you a neat, color-coded heads-up on market sentiment. Great for adding an extra dimension to your analysis without getting all tangled up in complex indicators

Like all our TradingView indicators, this one has custom alert conditions to make it fully CrossTrade compatible!

Check out another indicator...
VIX Heatmap
CrossTrade Logo
AriseHealth logoOE logo2020INC logofacebook iconEphicient logoThe Paak logo
Company
BlogPricingCareersAbout UsContact UsAffiliate Program
Resources
DownloadHelp DocsIndicatorsNinjaTraderTradingViewXT Alert Builder
Legal
Privacy PolicyRefund PolicyReferral ProgramTerms of ServiceTrading DisclaimerManage Preferences
CrossTrade facilitates the linkage between alert information sent from a user's chosen trading platform (TradingView) to their selected brokerage or exchange account (NinjaTrader). It is important to note that CrossTrade itself does not generate alerts or offer any trading advice whatsoever. The purpose of the CrossTrade platform is purely to aid traders and investors in implementing their own trading strategies based on their personal alerts. We do not advocate for the purchase or sale of any securities. Additionally, we do not provide any form of trading or investment advice. The platform and its assortment of features, capabilities, and tools are offered on an 'as-is' basis, without any form of warranty. It is crucial to understand that trading any asset carries significant risk and may not be suitable for all individuals. Engage in trading or investing only with capital that you can afford to risk losing.​​

CFTC Rule 4.41 (Hypothetical Disclaimer) U.S. Government Required Disclaimer - Commodity Futures Trading Commission Futures and Options trading has large potential rewards, but also large potential risk. You must be aware of the risks and be willing to accept them in order to invest in the futures and options markets. Don't trade with money you can't afford to lose. This is neither a solicitation nor an offer to Buy/Sell futures, stocks or options on the same. No representation is being made that any account will or is likely to achieve profits or losses similar to those discussed on this web site. The past performance of any trading system or methodology is not necessarily indicative of future results.

CFTC RULE 4.41 - HYPOTHETICAL OR SIMULATED PERFORMANCE RESULTS HAVE CERTAIN LIMITATIONS. UNLIKE AN ACTUAL PERFORMANCE RECORD, SIMULATED RESULTS DO NOT REPRESENT ACTUAL TRADING. ALSO, SINCE THE TRADES HAVE NOT BEEN EXECUTED, THE RESULTS MAY HAVE UNDER-OR-OVER COMPENSATED FOR THE IMPACT, IF ANY, OF CERTAIN MARKET FACTORS, SUCH AS LACK OF LIQUIDITY. SIMULATED TRADING PROGRAMS IN GENERAL ARE ALSO SUBJECT TO THE FACT THAT THEY ARE DESIGNED WITH THE BENEFIT OF HINDSIGHT. NO REPRESENTATION IS BEING MADE THAT ANY ACCOUNT WILL OR IS LIKELY TO ACHIEVE PROFIT OR LOSSES SIMILAR TO THOSE SHOWN.

Testimonials featured on this website are individual experiences and personal opinions from our users. They are not representative of all reasonably comparable accounts and should not be viewed as guarantees of future performance or success. Any mention of profits or specific returns has been excluded to ensure compliance with regulatory guidelines. Testimonials do not use exaggerated or misleading language and are not indicative of typical results. If a testimonial is paid or incentivized, it will be clearly disclosed.

The following trade names are mentioned on this website to highlight the interoperability of the CrossTrade technology offering with their platforms. CrossTrade is not associated with or endorsed by any of these organizations.​

- TradingView and the TradingView logo are registered trademarks of TradingView, Inc. and/or MultiCharts LLC.
- NinjaTrader, NinjaTrader.com, and other associated NinjaTrader trademarks and names are registered trademarks and property of NinjaTrader Group, LLC., and/or NinjaTrader Clearing, LLC., and/or other NinjaTrader affiliates and entities.
‍
© 2025 CrossTrade LLC. All right reserved.