Weekly OHLM Indicator
By downloading this indicator you agree to the terms in our Trading Disclaimer
Overview of Weekly OHLM
The "Weekly OHLM" is a versatile utility indicator designed for traders who focus on weekly price movements. This indicator offers a comprehensive view of an asset's weekly price range and dynamic signaling features. Here's a summary of its key functionalities and how it works:
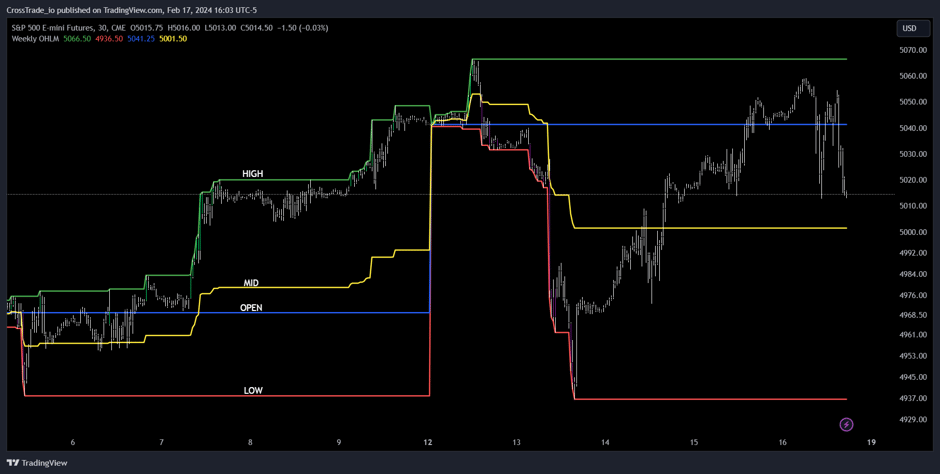
Weekly Price Levels: The indicator plots three critical levels based on weekly price data: the weekly high, weekly low, and weekly open. These levels are recalculated every week, providing a clear picture of the price range and the opening price for the week.
Midpoint Calculation: A crucial feature of this indicator is the calculation of the midpoint of the week's price range. This midpoint is derived by averaging the weekly high and weekly low, offering a reference point for the week's price equilibrium.
Dynamic Updating: As the week progresses, the indicator dynamically updates the weekly high and low if newer high or low prices are observed. This feature ensures that the plotted levels accurately reflect the current week's price movements.
Visual Highlights: The indicator uses color-coded plots to enhance visual clarity. The weekly high is marked in green, the weekly low in red, and the weekly open in blue. The midpoint is plotted in yellow, making it easily distinguishable.
Bar Coloring for New Highs and Lows: Bars that touch or surpass the weekly high are colored lime, and those that touch or drop below the weekly low are colored purple. This color-coding provides immediate visual cues about price touching these significant levels.
Alert System
The indicator includes a sophisticated alert system that notifies traders of specific events:
Crossing Over Midpoint: An alert is triggered when the price crosses over the midpoint, suggesting a potential upward movement.
Crossing Under Midpoint: An alert is activated when the price crosses under the midpoint, indicating a potential downward trend.
Weekly High and Low Touch: Alerts can also be set for when the price touches or exceeds the weekly high or low, signaling significant price movements.
This TradingView Pine Script Indicator is particularly useful for traders who base their strategies on weekly timeframes or need to understand weekly price dynamics in relation to intraday trading. By offering a clear view of important price levels and dynamic alerts, it aids in making informed trading decisions based on significant weekly price movements.